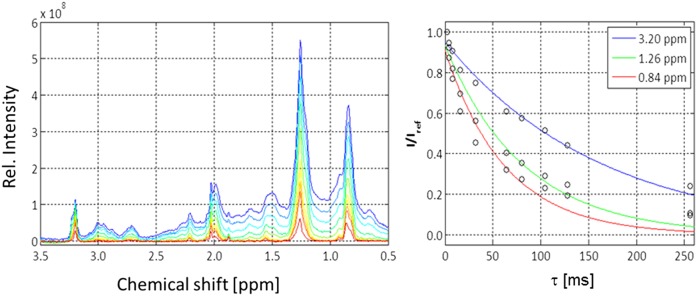
Fig. 8.
T2 relaxation of serum lipoproteins. T2 relaxation times of serum in the physiological extracellular buffer were measured with a CPMG-pulse sequence at 310 K. Left: NMR spectra recorded with different total waiting times τ, with τ = 2 ms (blue) and τ = 256 ms (red). The color code of the other spectra corresponds to an increase of the τ values. The actual τ values were 2, 4, 8, 16, 32, 64, 80, 104, 128, and 256 ms. Right: Plot of the signal intensities at 3.2, 1.26, and 0.84 ppm corresponding to the signals of choline-N(CH3)3, FA methylene groups, and methyl groups of FA and cholesterol as a function of τ. Rel., relative.

