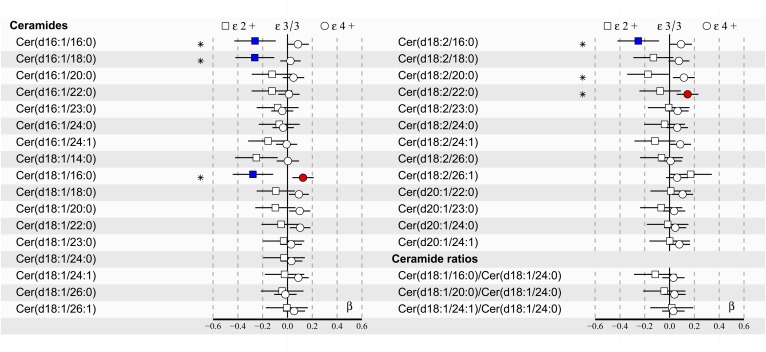
Fig. 1.
apoE effects on 30 plasma ceramides and 3 ceramide ratios in all subjects (n = 2,160) of the YFS cohort in the 2007 follow-up. Regression models were adjusted for age, BMI, and sex. Regression β-coefficients (x-axis) indicate in SD units the change in the lipid measure over apoE genotype subgroups (ε2+, ε3/3, ε4+). The most common ε3/3 subgroup (n = 1,241) is set at the origin (zero SD) and compared post hoc with ε2+ (squares) and ε4+ (circles) subgroups. β-values with 95% CIs are scaled to SD increments from normalized (i.e., ln-transformed) lipid measures. *F-tested effect of apoE with P < 0.05 after FDR correction in the regression model. The post hoc difference with P < 0.05 after FDR correction from ε3/3 is indicated with colors (blue: ε2+; red: ε4+). The apoE ε2+ subgroup (n = 146) includes ε2/2 and ε3/2, and the apoE ε4+ subgroup (n = 773) includes ε4/2, ε4/3, and ε4/4.

