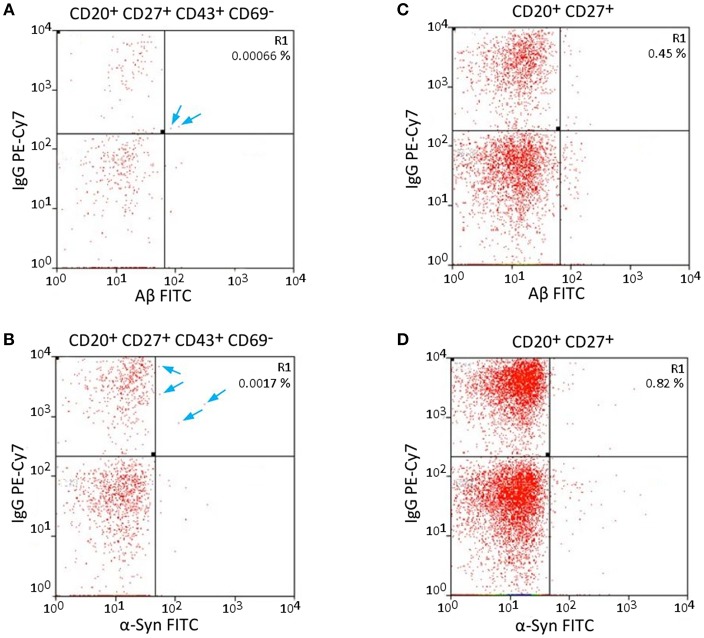
Figure 2.
Specific and non-specific gating of Aβ- and α-Syn-FITC signals shows possible error sources. (A,C) Aβ-FITC and (B,D) α-Syn-FITC. Different gates were applied to the same sample. (A,B) Same gating procedure as in Figure 1. (C,D) CD43 and CD69 were omitted for gating. The cells in gate R1 are not necessarily B1 cells, as the gating is not B1 cell specific. Arrows indicate single cells in gate R1 in (A,B).

