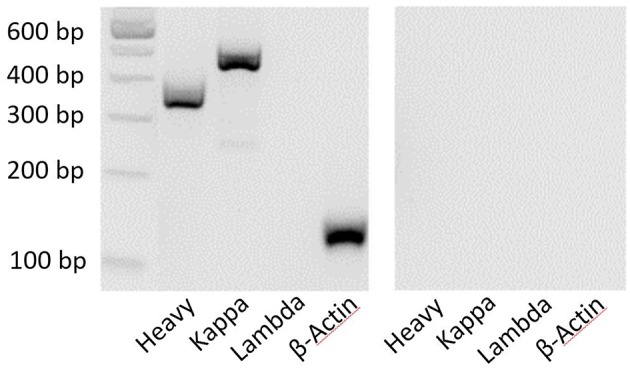
Figure 3.

Clear bands by agarose gel electrophoresis show the composition of antibody chains. PCR products were electrophoresed for 90 min at 110 mV. The 100-bp DNA ladder provides an objective size indicator. A representative sample is shown on the left, and the negative control (water) is shown on the right.
