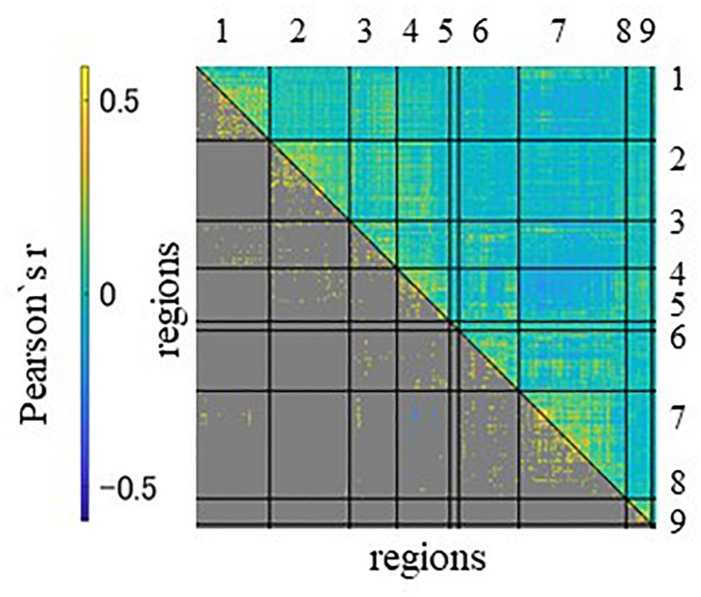
FIGURE 2.
The region-with-region functional connectivity matrix of 45 subjects, sorted by network assignment. The upper triangle contains all connectivity, the lower only the significant ones. The significances were estimated by the permutation test with 10,000 runs. A significant threshold was considered p < 0.05, with a peak family-wise false positive rate (FWE) corrected. Columns and rows represent regions of interest (ROIs) for resting state, which are grouped according to seven networks and two anatomical regions. Networks and anatomical regions from left to right and top to bottom as follows: 1, visual; 2, somato-motor; 3, dorsal attention; 4, ventral attention; 5, fronto-temporal; 6, fronto-parietal; 7, default mode networks; 8, basal ganglia; and 9, cerebellum. Diagonal and non-diagonal sections show functional connectivity within- and between-network for these ROIs, respectively.

