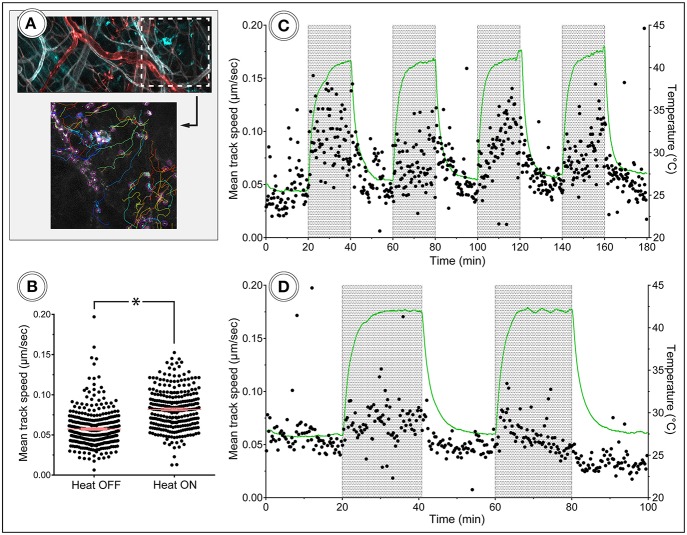
Figure 9.
In vivo tracking of leukocyte migration during heat challenge. (A) Shows a frame from the corresponding time-lapse movie and tracking data. Color code: Ly6G–cyan, CD31–gray, NG2–red. (B) Migration speed of neutrophils was increased during heating periods compared to periods without heating. (C,D) Show track speed of neutrophils and CX3CR1 positive cells, respectively, plotted over time with heating periods indicated by gray areas.

