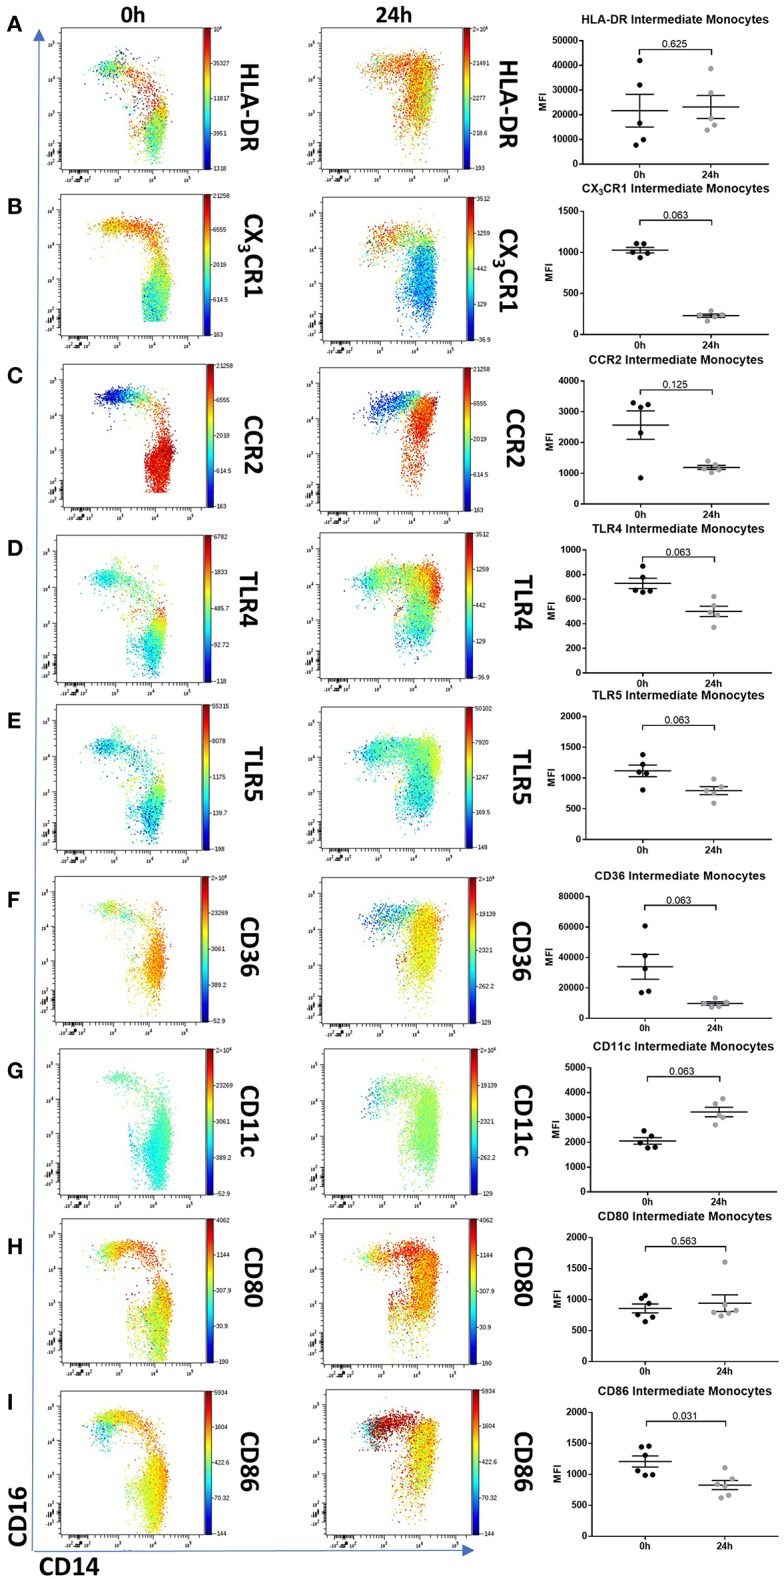
Figure 6.

Intermediate monocytes have an altered phenotype after 24 h culture ex vivo. Representative viSNE plots (Cytobank, Santa Clara, USA) showing monocyte subsets illustrating expression of CD14 (X axis) and CD16 (Y axis). Median fluorescence intensity for each fluorochrome-conjugated antibody is represented according to the color bar shown. PBMCs sampled from healthy controls were incubated for 0 and 24 h in culture medium. (A) 24 h culture did not reduce intermediate monocytes HLA-DR expression but resulted in a reduced trend of (B) CX3CR1, (C) CCR2, (D) TLR4, (E) TLR5, and (F) CD36. Twenty-four hours culture increased intermediate monocyte expression of (G) CD11c, had no effect on (H) CD80 and a marginal reduction of (I) CD86. PBMCs sampled from 5 healthy controls were incubated for 0 and 24 h in culture medium and the expression for each fluorochrome-conjugated antibody on intermediate monocytes was illustrated in a dot plot.
