Figure 2.
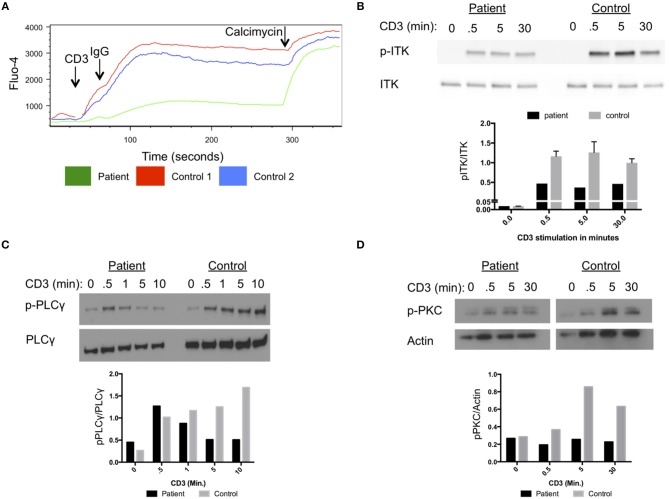
Impaired T cell receptor signaling in cells from the patient with homozygous ITK mutations. (A) Impaired calcium flux in the patient compared to healthy controls following anti-CD3 crosslinking, plotted by Fluo-4 as a function of time. (B) Impaired phosphorylation of ITK in patient cells following stimulation for the indicated times with anti-CD3 antibody, compared to control cells. (C) Phosphorylation of PLCγ at various times after CD3 stimulation in patient and control. Total PLCγ served as a loading control. (D) Phosphorylation of PKC in patient cells following CD3 stimulation at various times compared to control. Actin served as a loading control. (B–D) The graphs show quantification of the blots. The experiments were repeated three times and a representative result is shown.

