Figure 2.

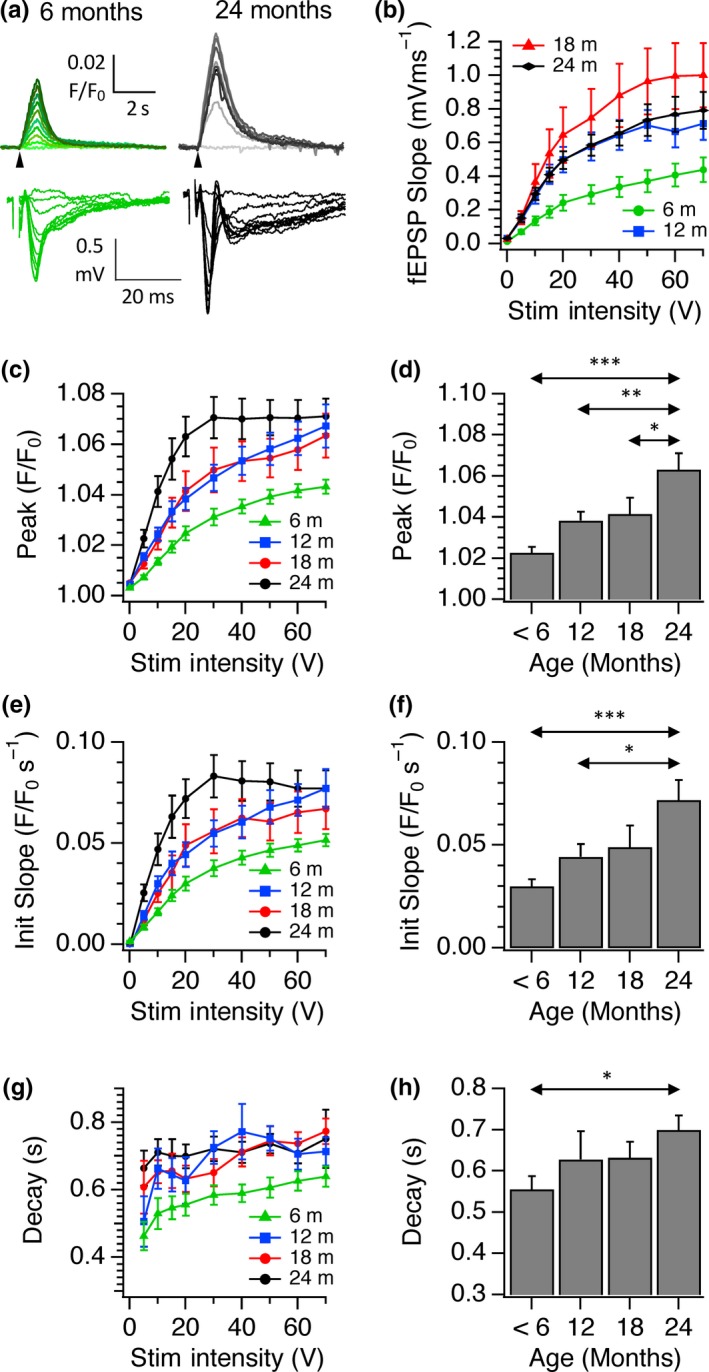
The effect of age on input–output relationships for SyGCaMP2 responses and fEPSPs to electrical stimulation of the SC pathway to CA1. (a) Examples of recordings of SyGCaMP2 fluorescence (F/F 0) from 6‐month‐old (green traces) and 24‐month‐old hippocampal slices (greyscale traces). Representative fEPSs are shown underneath. Stimulus intensities were increased from 0 to 70V. (b) Pooled data showing mean ± SEM fEPSP slopes recorded from slices taken from groups of animals at age ranges of up to 6 months, 12, 18 and 24 months. Panels (c), (e) and (g) illustrate pooled data of the peak amplitude, initial slope and fast decay time constant of SyGCaMP2 responses. Means and SEMs from n = 36 (<6 months), n = 16 (12 months), n = 13 (18 months) and n = 18 (24 months) are shown. Panels (d), (f) and (h) show the mean peak, slope and fast decay values measured at 20 V. Double‐headed arrows indicate where statistical differences were observed and asterisks indicate the level of significance (*p < .05; ** p < .01; *** p < .001; 1‐way ANOVA with Tukey post hoc test)
