
Figure 1.
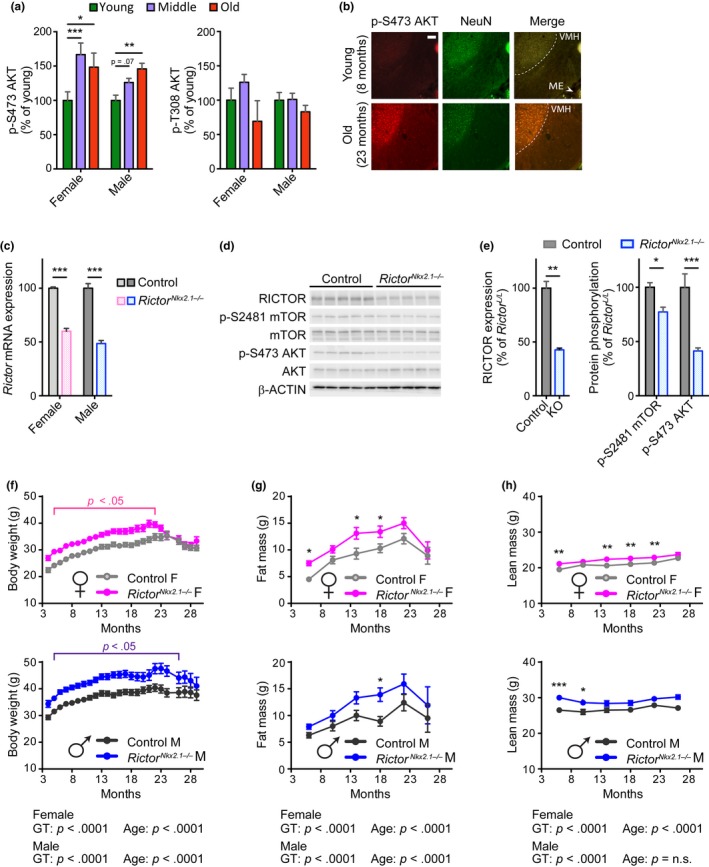
Hypothalamic mTORC2 signaling increases with age and regulates body weight homeostasis. (a) Quantification of phosphorylated AKT residues in whole brain lysate from fasted female and male C57BL.6J.Nia mice; young refers to 6‐month‐old males and females (10 males, 5 females), middle refers to 24‐month‐old males and 22‐month‐old females (10 males, 5 females), and old refers to 30‐month‐old males and 26‐month‐old females (8 males, 4 females). Quantification of phosphorylated proteins are relative to total protein (Dunnett's test following two‐way ANOVA, * = p < .05, ** = p < .01, *** = p < .001). (b) mTORC2 activity, as determined by IHC‐IF for phosphorylated Akt S473 (in red), is increased in the hypothalamus of overnight fasted 23‐month‐old female C57BL.6J.Nia mice relative to young 8‐month‐old mice. A neuronal nuclei marker is targeted by the NeuN antibody (in green), showing the mTORC2 signaling is increased in aged neurons in these regions. Shown are representative images of hypothalamic regions (total n examined = 4 mice/group). Scale bar = 100 µm. (c) Expression of Rictor mRNA in hypothalamic tissue of 3‐ to 6‐month‐old RictorNkx2.1−/− mice and controls (n = 5‐8/group; *** = p < .001, Holm–Sidak test following two‐way ANOVA). (d) Hypothalamic protein lysates from 6‐month‐old male control and RictorNkx2.1−/− mice were immunoblotted for phosphorylated and total AKT, phosphorylated and total mTOR, RICTOR, and β‐ACTIN. (e) Quantification of RICTOR expression relative to β‐ACTIN and phosphorylated mTOR and AKT relative to total protein (n = 5 control and 9 RictorNkx2.1−/− mice; left: ** = p < .01, t test; right: Holm–Sidak test following two‐way ANOVA, * = p < .05, *** = p < .001). (f) Longitudinal assessment of body weight of control and RictorNkx2.1−/− mice (n = 5–35 per group; p < .05 indicates significant difference between genotypes at each time point within the indicated range, Holm–Sidak test following two‐way ANOVA). (g, h) Longitudinal assessment of (g) fat mass and (H) lean mass of control and RictorNkx2.1−/− mice (n = 5–29 mice/group; Holm–Sidak test following two‐way ANOVA, * = p < .05, ** = p < .01, *** = p < .001). (f–h) The overall effect of genotype (GT), age, and the interaction represents the p‐value from a two‐way ANOVA. Error bars represent the SEM