Figure 1.

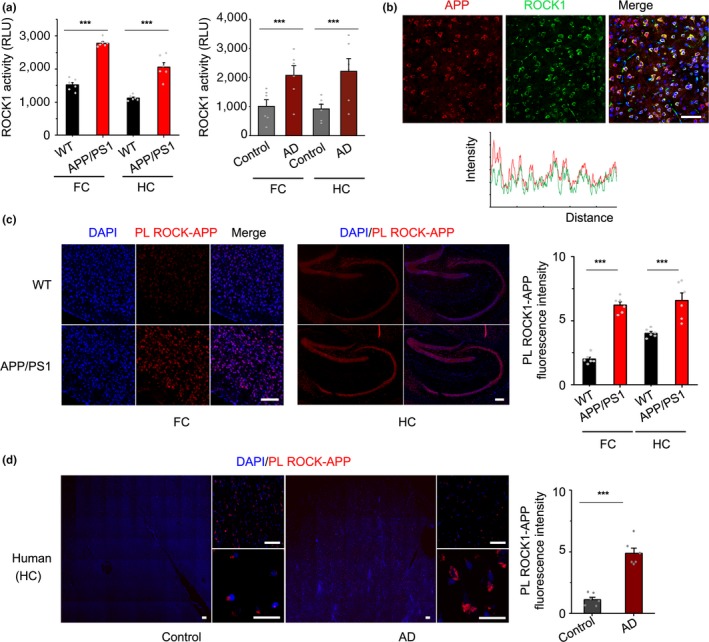
Up‐regulated ROCK1 activity and its interaction with APP in AD. (a) left panel, ROCK1 activity increased in the frontal cortex (FC, t 10 = 4.64) and hippocampus (HC, t 10 = 4.9) of 8‐month APP/PS1 mice relative to wild‐type control (WT) by kinase assay. right panel, ROCK1 activity increased in the frontal cortex (FC, t 10 = 5.36) and hippocampus (HC, t 10 = 4.67) of AD patients relative to normal control. (b) Co‐localization between APP and ROCK1 in the brain of APP/PS1 mice. Fluorescence intensity profiles are also presented, measured along the line marked in the fluorescent images. Scale bar, 50 μm. (c) Proximity ligation and quantification of PLA signal between ROCK1 and APP in the cortex (t 10 = 18.94) and hippocampus (t 10 = 6.33) of APP/PS1 and WT mic. Scale bar, 50 μm. (d) Proximity ligation and quantification of PLA signal between ROCK1 and APP in the hippocampus of AD patients and normal control, t 10 = 8.68. Scale bar, 50 μm. Data were presented as Mean ± SEM. Significance was assessed by two‐tailed Student's t test. n = 6, ***p < 0.001
