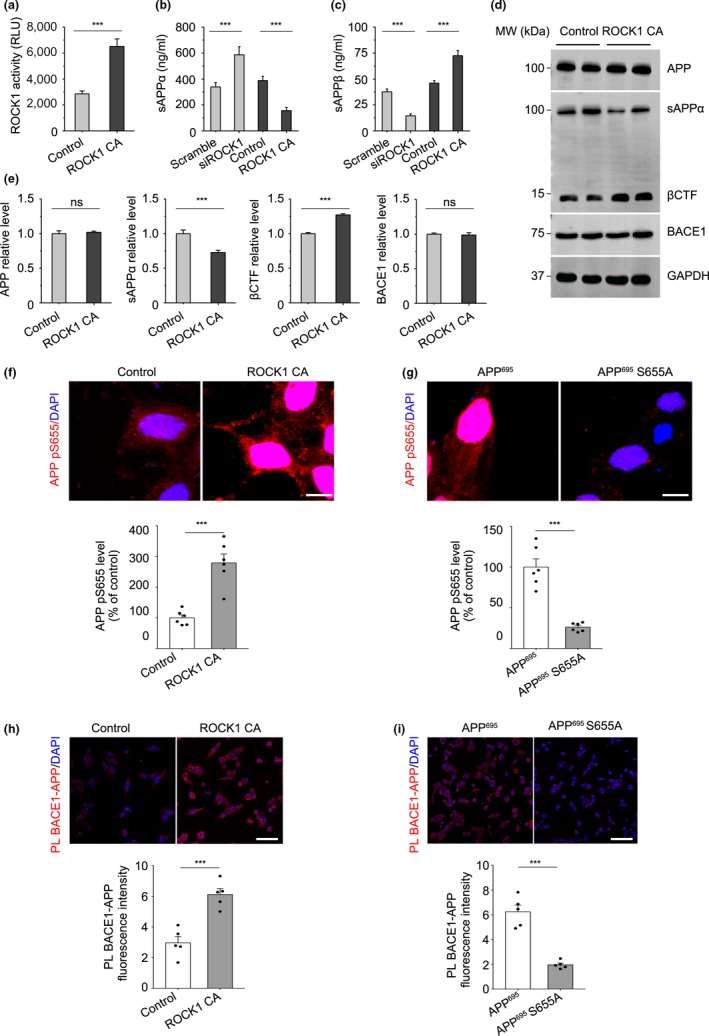
Figure 3.

ROCK1 promotes APP amyloidogenic processing. (a) ROCK1 activity increased after ROCK1 CA plasmid transfection relative to control in HEK 293T APPsw cells by kinase assay (t 18 = 4.48). (b) The levels of sAPPα analyzed by ELISA kit after 72 hr following ROCK1 CA plasmid and siROCK1 transfection in HEK 293T APPsw cells (F 3,30 = 5.3). (c) The levels of sAPPβ were analyzed by ELISA after 72 hr following ROCK1 CA plasmid and siROCK1 transfection in HEK 293T APPsw cells (F 3,30 = 7.7). (d) After ROCK1 CA plasmid transfection in HEK 293T APPsw cells, 72 hr later, cell lysates were prepared and APP (full‐length, APP‐FL), sAPPα, βCTF, and BACE1 were analyzed by Western blot. GAPDH was used as loading control. (e) Quantification of APP, sAPPα, βCTF, and BACE1 expression after ROCK1 CA plasmid transfection. Relative ratio to GAPDH was calculated by densitometry analysis. (f) Immunofluorescence and quantification of phosphorylated APP at S655 (APP pS655) after ROCK1 CA plasmid transfection relative to control in HEK 293T APPsw cells (n = 6, t 10 = 5.88). Scale bar, 5 μm. (g) Immunofluorescence and quantification of phosphorylated APP at S655 (APP pS655) after APP695 and S655A plasmid transfection in HEK 293T cells (n = 6, t 10 = 7.12). Scale bar, 5 μm. (h) Proximity ligation and quantification of PLA signal between BACE1 and APP after ROCK1 CA plasmid transfection relative to control in HEK 293T APPsw cells (n = 5, t 8 = 7.62). Scale bar, 20 μm. (i) Proximity ligation and quantification of PLA signal between ROCK1 and APP after APP695 and S655A plasmid transfection in HEK 293T cells (n = 5, t 8 = 6.11). Scale bar, 20 μm. Data were presented as Mean ± SEM. Two‐tailed unpaired Student's t test. ***p < 0.001
