Figure 6.

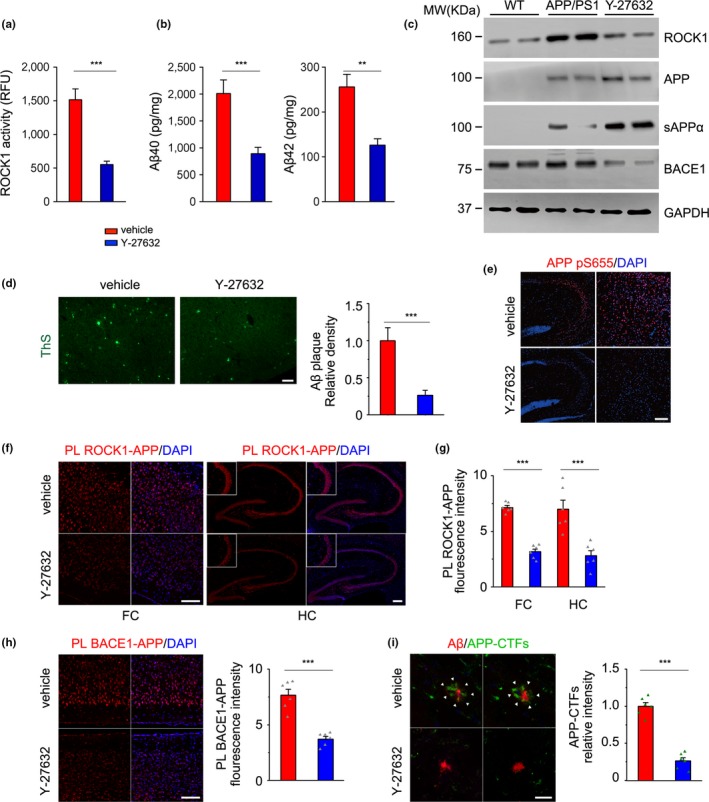
ROCK1 inhibition decreases APP amyloidogenic metabolism and amyloid pathology in vivo. Mouse brain homogenates were prepared from 8‐month‐old APP/PS1 and WT mice after Y‐27632 treatment. (a) ROCK1 activity was decreased in the brain of APP/PS1 mice after Y‐27632 treatment as measured by kinase assay (t 8 = 5.87). (b) Aβ40 and Aβ42 levels (t 8 = 4.71, t 8 = 6.13) in mouse brain homogenates were analyzed by ELISA. (c) ROCK1, APP, sAPPα, and BACE1 in mouse brain homogenates were analyzed by Western blot. GAPDH was used as internal control to normalize the calculated abundance of the targeted proteins. (d) Immunofluorescence and quantitative analysis of Aβ plaque burden in the brains of APP/PS1 mice after Y‐27632 treatment (t 10 = 5.16). Scale bar, 50 μm. (e) Immunofluorescence of phosphorylated APP at S655 (APP pS655) after Y‐27632 treatment. Scale bar, 50 μm. (f) Proximity ligation between ROCK1 and APP in the frontal cortex (FC) and hippocampus (HC) of APP/PS1 mice after Y‐27632 treatment. Scale bar, 50 μm. (g) Quantitative analysis of PL signals between ROCK1 and APP in the FC (t 10 = 12.79) and HC (t 10 = 6.75) of APP/PS1 mice after Y‐27632 treatment. (h) Proximity ligation between BACE1 and APP in the cortex of APP/PS1 mice after Y‐27632 treatment and quantitative analysis of the PL signals (t 10 = 6.75). Scale bar, 50 μm. (i) Immunofluorescence of Aβ plaque (red) and APP‐CTFs (green) and quantitative analysis of APP‐CTFs in the diffuse part of amyloid plaques (t 10 = 11.06). Scale bar, 20 μm. Data are presented as mean ± SEM. n = 5–7 per group; Two‐tailed unpaired Student's t test and one‐way ANOVA followed by Student–Newman–Keuls post hoc analysis. ***p < 0.001; **p < 0.01; *p < 0.05
