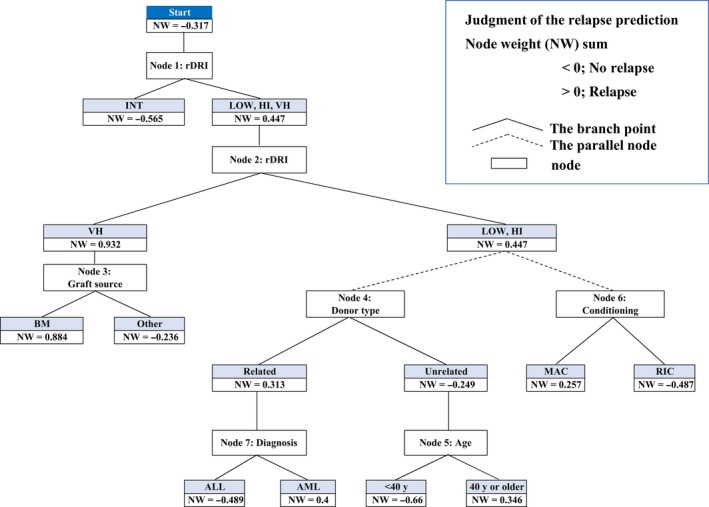
Figure 2.

Relapse prediction model; Graphical output. Each score beside nodes showed a prediction node weight (NW); NW < 0 means a lower relapse risk and NW > 0 a higher relapse risk. The final judgment of the AL relapse prediction was achieved by summing all the nodes through which it passed (NW sum). The NW sum > 0 predicted relapse and <0 predicted no relapse in this model
