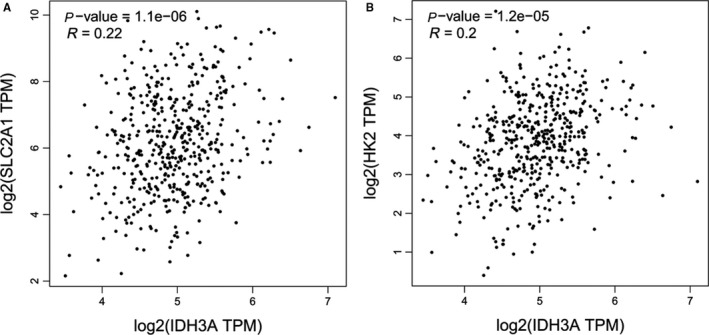
Figure 6.

Relationship between IDH3a expression and related indicators (GLUT1 and HK2) were studied with bioinformatics analysis using GEPIA. (A) Mild correlation with coefficient of 0.22 was found between IDH3a with GLUT1. (B) Mild correlation with coefficient of 0.2 was found between IDH3a with HK2
