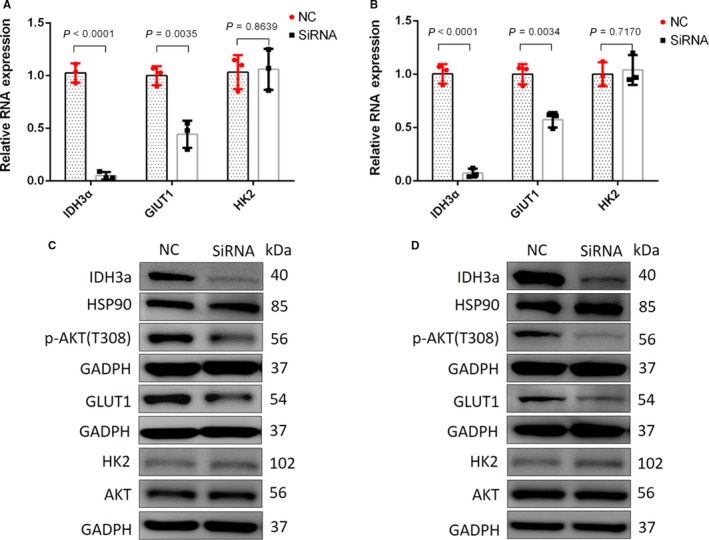
Figure 7.

After silencing of IDH3a, GLUT1, and HK2 mRNA expression were measured by RT‐PCR. GLUT1, HK2, p‐AKT, and AKT level were detected using western blotting of A549 and H1299. (A, B) The relative expression of target genes (IDH3ɑ, GLUT1, and HK2) of A549 and H1299 were calculated using the 2−ΔΔCt method, using β‐actin as the internal reference. The fold change of treated group comparing to NC group was obtained after log‐transformation. Independent t‐test was used for statistical analysis. All tests were performed in independent triplicate experiments. The results showed a significant decrease in GLUT1, but not in HK2 mRNA expression. Measurements were performed in three independent experiments; (C, D) Western blotting of A549 and H1299 showed that the expression of IDH3a was significantly decreased after silencing of IDH3a, corresponding p‐AKT and GLUT1 expression levels were downregulated, while the expression of HK2 remained unchanged. All experiments were performed in triplicate. IDH, isocitrate dehydrogenase; GLUT1, glucose transporter 1; HK2, hexokinase 2
