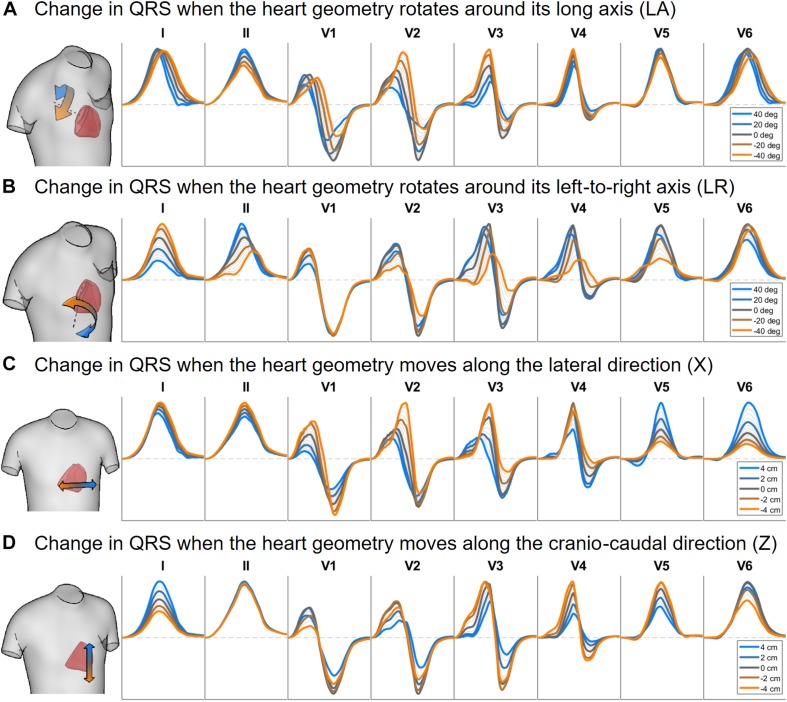
FIGURE 6.
Simulated QRS complex in leads I, II and V1 to V6 for different rotation angles around the long axis (A) and the left-to-right-ventricle direction (B), and for different heart translations along the lateral (C) and cranio-caudal (D) directions. Gray lines correspond to intermediate results showing how the signals evolve from one colored state to another. The heart and torso geometries correspond to subject 3.

