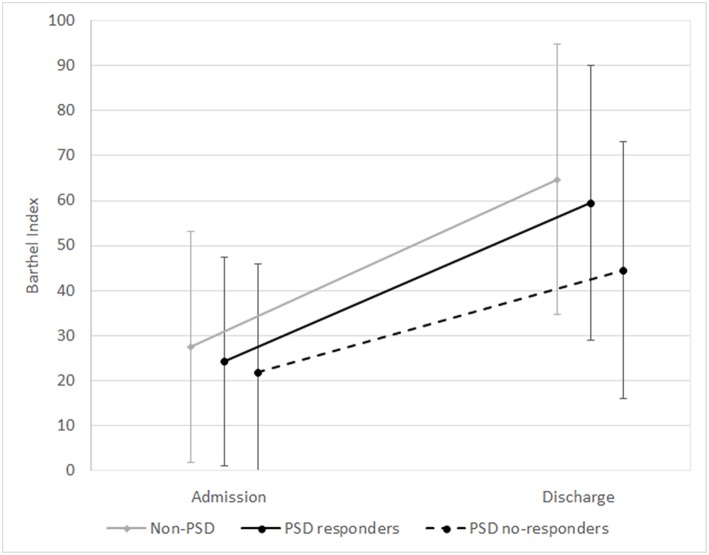
Figure 1.
Means and standard deviations of Barthel Index scores at admission and discharge in the subgroups (non-PSD, PSD responders, and PSD non-responders). Non-PSD discharge vs. baseline z = −12.63, p < 0.001. PSD responders: discharge vs. baseline z = −12.77, p < 0.001. PSD non-responders: discharge vs. baseline z = −4.94, p < 0.001. (Wilcoxon Signed Ranks Test).

