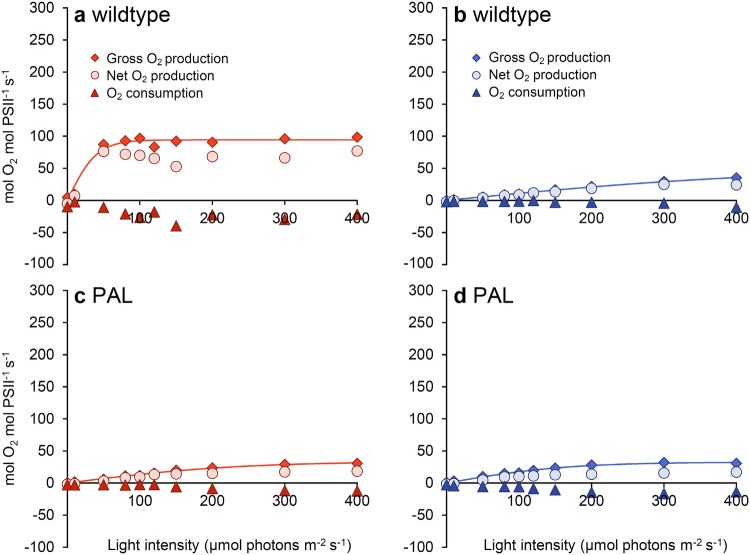
Fig. 3.
O2 production and consumption rates per PSII of Synechocystis sp. PCC 6803 wildtype (a, b) and the PAL mutant (c, d). Cells were acclimated to orange-red (a, c) or blue (b, d) light and subsequently exposed to increasing intensities of the same light color. The data show averages of gross photosynthetic O2 production (diamonds), net O2 production (circles), and O2 consumption (triangles), measured in duplicate samples using membrane-inlet mass spectrometry (MIMS). Lines represent P–I curves fitted to the gross O2 production using the hyperbolic tangent function; parameter estimates are given in Table 2

