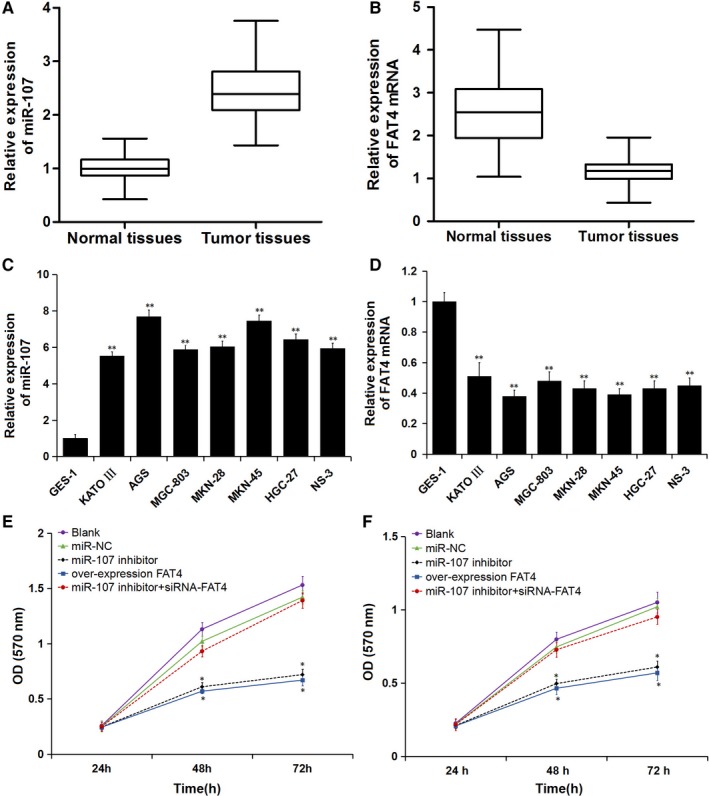
Figure 2.

Expression of miR‐107 and FAT4 mRNA in GC tissues and cell lines and cell proliferation following transfection. A, Expression of miR‐107 in GC tissues; B, Expression of FAT4 mRNA in GC tissues; C, Expression of miR‐107 in GC cells; D, Expression of FAT4 mRNA in GC cells; **P < 0.01 vs GES‐1 cell. E and F, Cell proliferation ability curves of AGS cells and MKN‐45 cells; *P < 0.05 vs blank and miR‐NC groups
