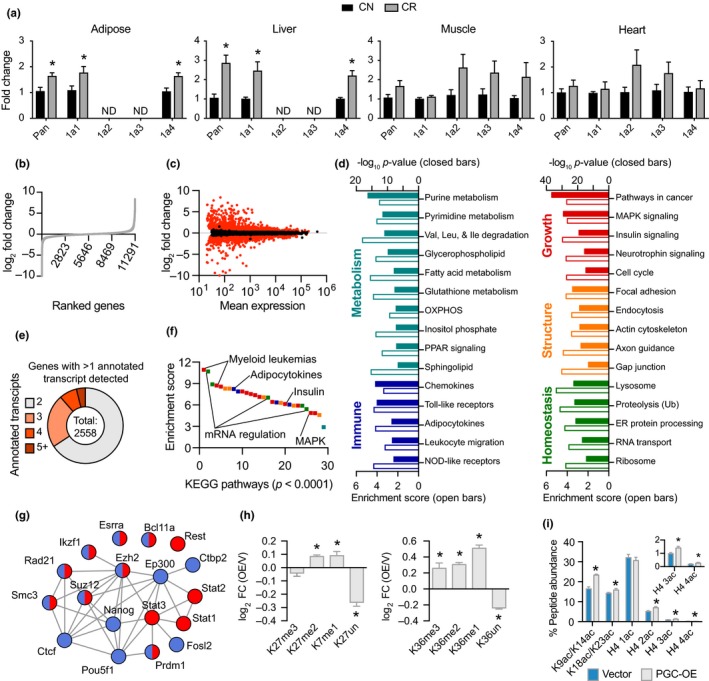
Figure 1.

Moderate, stable PGC‐1a overexpression is associated with a large transcriptional network. (a) Detection of PGC‐1a isoform expression in tissues from 12‐month‐old mice on 25% CR from 2 months of age. (b) Ranked fold change of all detected genes between control and PGC‐OE cells and (c) fold change as a function of mean expression with differentially expressed (DE) genes in red (p < 0.01, absolute FC > 1.2), n = 4. (d) KEGG pathway analysis. (e) Proportion of genes with multiple annotated transcript isoforms. (f) Rank ordered KEGG pathways by enrichment score; colors indicate panel (c) categories. (g) ENCODE factors associated with upregulated (red) and downregulated (blue) DE genes. (h) Fold change of histone H3K27 and K36 methylation and (i) quantitation of histone acetylation by mass spectrometry, n = 6. Pan, pan‐PGC‐1a isoform expression; 1a1, PGC‐1a1 isoform, etc. Data shown as means ± SEM; asterisk (*) indicates p < 0.05 by two‐tailed Student's t test
