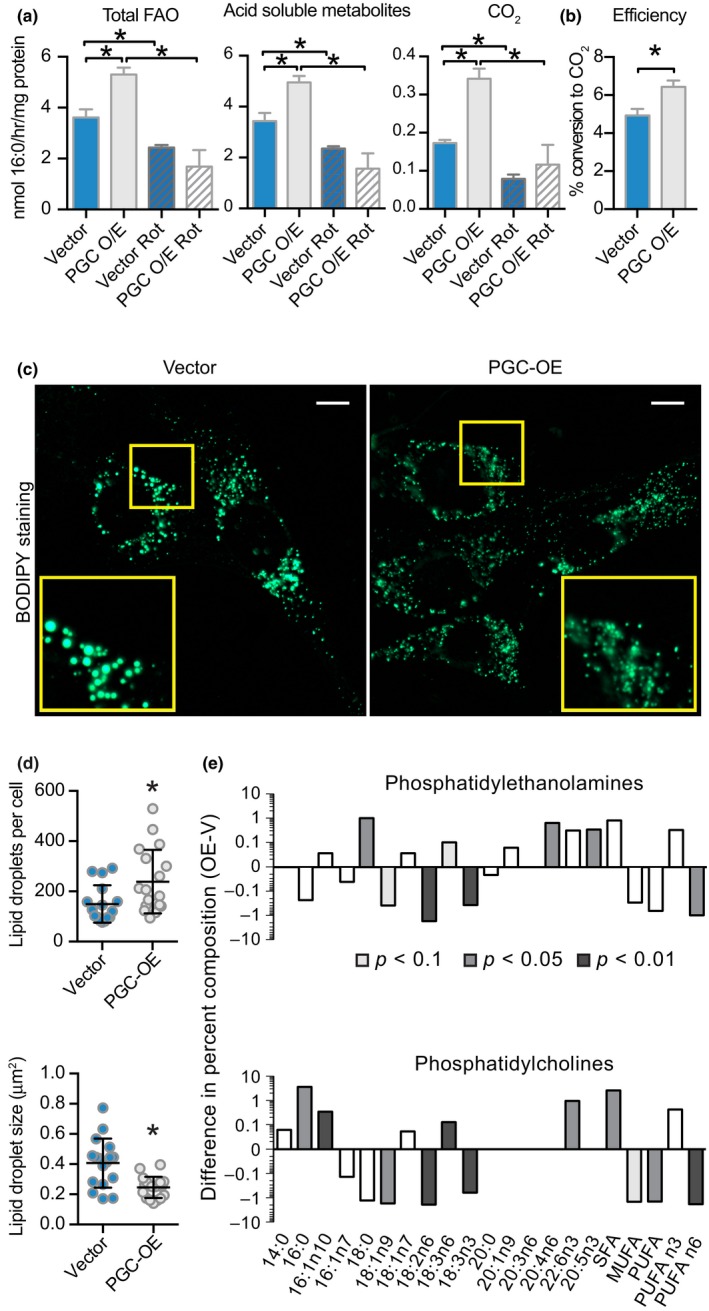
Figure 3.

Altered lipid metabolism in PGC‐OE cells. (a) Palmitate fatty acid oxidation radioassay and (b) oxidation efficiency, n = 6 or n = 3 for rot treatment. (c) BODIPY 493/503 neutral lipid stain representative images (scale bar 10 μm), (d) quantitation of lipid droplet number and average droplet size, n = 16 vector and 19 PGC‐OE cells. (e) Phospholipid percent composition represented as the difference between means of PGC‐OE and vector cell lines, n = 3. rot, rotenone. Data shown as means ± SD (d) or means ± SEM; asterisk (*) indicates p < 0.05 by two‐tailed Student's t test
