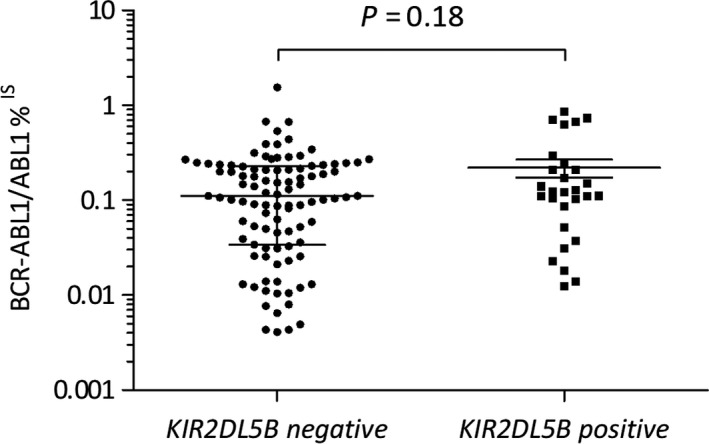
Figure 2.

BCR‐ABL1/ABL1 IS and KIR2DL5 expression levels according to KIR2DL5 genotype. Scatter dot plots represent BCR‐ABL1%IS for each individual relapsing patient at relapse confirmation, median values and interquartile range are also shown (N = 128)
