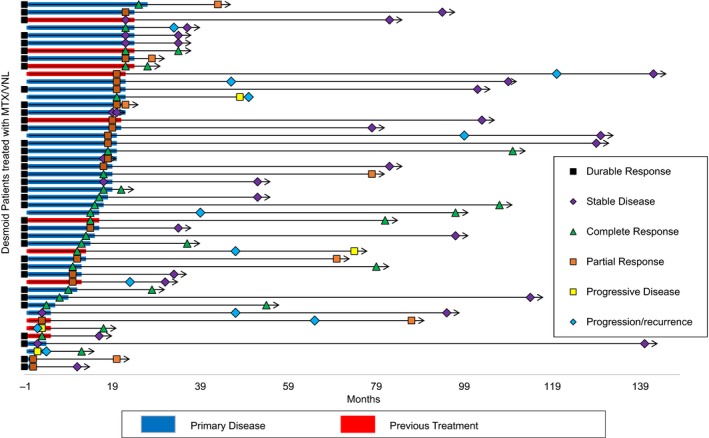
Figure 3.

Treatment duration, follow‐up, and response for all patients. Swimmers plot demonstrating the individual patients' treatment duration, follow‐up, and response at end of treatment and point of last follow‐up. Each bar represents one subject in the study. Treatment duration is shown by primary presentation (refers to patients within our institution in which disease progressed, PD, during observation, hormonal, or NSAID therapy) versus recurrent/residual presentation (treated at outside hospitals and referred for PD) from time zero, that is, from start of MTX/VNL treatment (blue and red horizontal bars, respectively). Response at treatment end is highlighted (refer figure key). Durable response is defined as a subject who has confirmed response‐ CR, PR, or SD at last follow‐up without recurrence. Length of follow‐up (solid arrows) and response at last point of contact is documented
