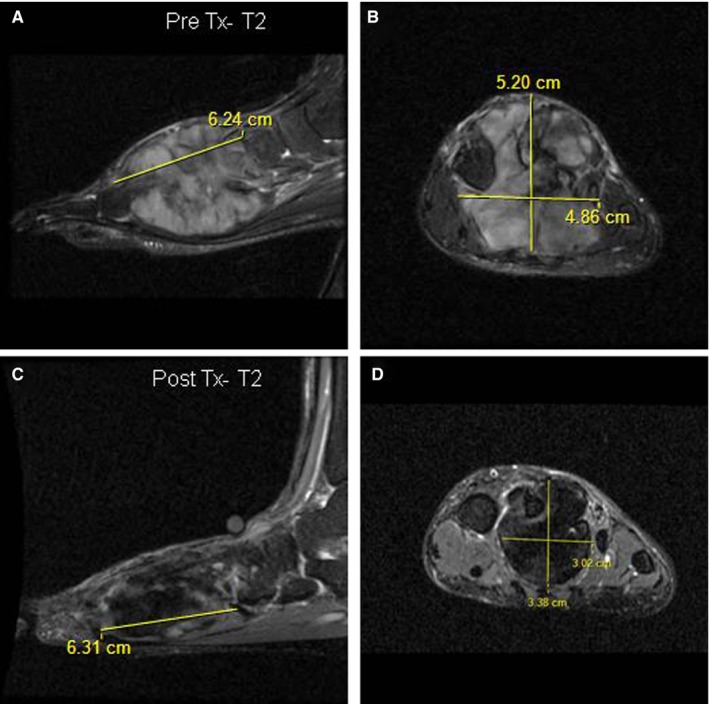
Figure 4.

MRI imaging showing T2 characteristics of DF in foot in response to MTX/VNL. T2‐fat‐saturated sagittal and coronal MRI images of DF in left foot pre‐ (A and B) and post‐ (C and D) MTX/VNL. No response to treatment (Tx) as per D max with no change in the longest axis of the DF (6.2 vs 6.3 cm), compared with significant treatment response seen by decreased V tumor (83 to 34 cm3) and T2 intensity (50%‐75% to 0%‐25%)
