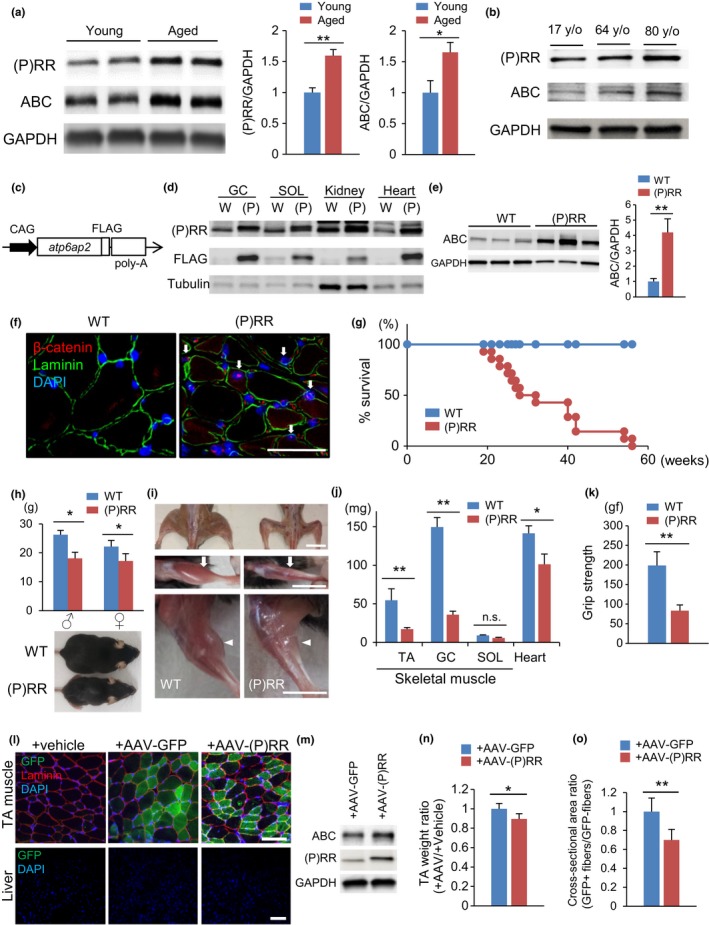
Figure 1.

(P)RR‐Tg mice exhibit skeletal muscle atrophy with activation of β‐catenin signaling. (a) Western blotting of (pro)renin receptor ((P)RR) and active β‐catenin (ABC) expression in total protein extracts from the gastrocnemius muscle (GC) of young (12‐week‐old) and aged 100‐week‐old) WT mice (left) and quantification by densitometry (right) (n = 6). (b) (P)RR and ABC protein levels in total protein extracts from human muscles of 17‐, 64‐, and 80‐year‐old volunteers (<40 y/o: n = 3; 40–60 y/o: n = 3; 65 y/o<: n = 3). (c) Schematic representation of the transgenic construct. FLAG‐tagged murine atp6ap2 ((P)RR) cDNA is expressed under control of the CAG promoter. (d) Western blotting of forced (P)RR and FLAG protein expression in GC, SOL, kidney, and heart from (P)RR‐Tg mice. (e) Western blotting of ABC expression in total protein extracts from the GC of WT and (P)RR‐Tg mice (left) and quantification by densitometry (right) (n = 6). (f) Immunohistochemical staining with anti‐ABC (red) and anti‐laminin (green) antibodies showing translocation of β‐catenin into the nucleus of GC cells in (P)RR‐Tg mice. Nuclei were labeled with DAPI (blue). Scale bar, 100 mm. (g) Kaplan–Meier survival curve for WT and (P)RR‐Tg mice (n = 12). (h) Body weight in WT and (P)RR‐Tg mice. The data of female or male (P)RR‐Tg mice are presented relative to their same‐sex WT counterparts (n = 8) (top). Whole‐body image of WT and (P)RR‐Tg mice (bottom). Scale bar, 10 mm. (i) Muscle atrophy in TA (white arrow) and GC (white arrowhead) of (P)RR‐Tg mice. (j) Comparison between muscle (TA, GC, and SOL) and heart weight between WT and (P)RR‐Tg mice (n = 7). (k) Handgrip strength of WT and (P)RR‐Tg mice (n = 8). (l) Immunostaining for GFP (green) and laminin (red) in cross sections of AAV‐GFP‐injected or AAV‐(P)RR‐injected TA and vehicle‐injected contralateral TA in 8‐week‐old WT mice. Nuclei were labeled with DAPI (blue). Scale bar, 100 mm. (m) Western blotting of ABC and (P)RR in total protein extracts from TA injected with AAV‐(P)RR or AAV‐GFP. (n) Comparison of the weight ratio of AAV‐treated versus vehicle‐treated TA (n = 5). (o) Comparison of cross‐sectional area ratio of GFP‐positive to GFP‐negative myofibers in AAV‐treated TA (n = 5, N = 100 per group). Data represent the mean ± SEM. *p < 0.05 and **p < 0.01; n.s., not significant, as determined by the Mann–Whitney U test
