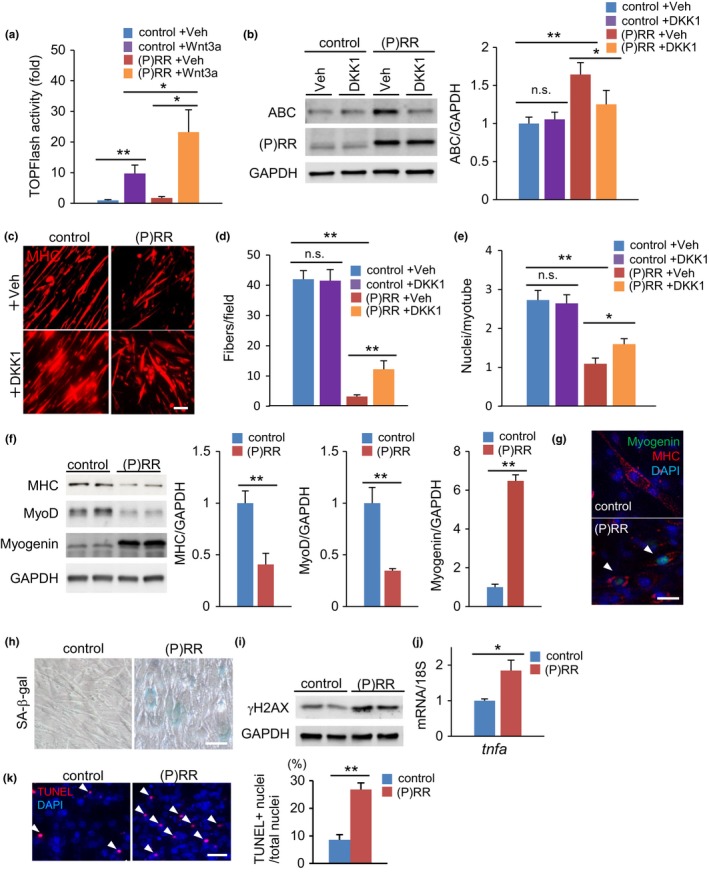
Figure 4.

Myotube formation in (pro)renin receptor ((P)RR)‐expressing C2C12 myoblasts is impaired by cell fusion failure due to activation of (P)RR‐induced Wnt signaling. (a) TOPFlash activity of control and (P)RR‐expressing C2C12 myoblasts with or without Wnt3a stimulation (n = 7). (b) Western blotting of active β‐catenin (ABC) and (P)RR expression in total protein extracts from a C2C12 cell line stably expressing (P)RR cultured in growth medium with vehicle or DKK1 (left) and quantification by densitometry (right) (n = 6). GAPDH was used as internal control for total protein. (c) Immunofluorescence analysis with anti‐MHC antibody of control and (P)RR‐expressing C2C12 cells cultured in differentiation medium to induce myotube formation. Scale bars, 100 mm. (d) Number of MHC‐positive myotubes per field of high‐magnified view (×400) in control and (P)RR‐expressing C2C12 myoblasts after 4 days in differentiation medium, with or without DKK1 treatment (n = 6). (e) Number of nuclei per myotube formed in control and (P)RR‐expressing C2C12 cells with or without DKK1 treatment (n = 6). (f) Western blotting of MHC, MyoD, and myogenin expression in total protein extracts from a C2C12 cell line stably expressing (P)RR cultured in differentiated medium (left) and quantification by densitometry (n = 6) (right). GAPDH was used as internal control for total protein. (g) Immunostaining for myogenin (green) and laminin (red) in control and (P)RR‐expressing C2C12 myotubes. Nuclei were labeled with DAPI (blue). Scale bar, 50 mm. (h) SA‐β‐gal staining in control and (P)RR‐expressing C2C12 myotubes. Scale bars, 50 mm. (i) Western blotting of γH2AX in total protein extracts of control and (P)RR‐expressing C2C12 myotubes. (j) Relative expression levels of the tnfa gene in control and (P)RR‐expressing C2C12 myotubes (n = 6). (k) TUNEL staining (left) and the ratio of TUNEL‐positive nuclei to total nuclei in control and (P)RR‐expressing C2C12 myotubes. (n = 5, N = 100 per group) Scale bars, 50 mm. Data represent the mean ± SEM. *p < 0.05 and **p < 0.01; n.s., not significant, as determined by the Mann–Whitney U test (f,j,k) or ANOVA followed by the Bonferroni post‐hoc correction (a,b,d,e)
