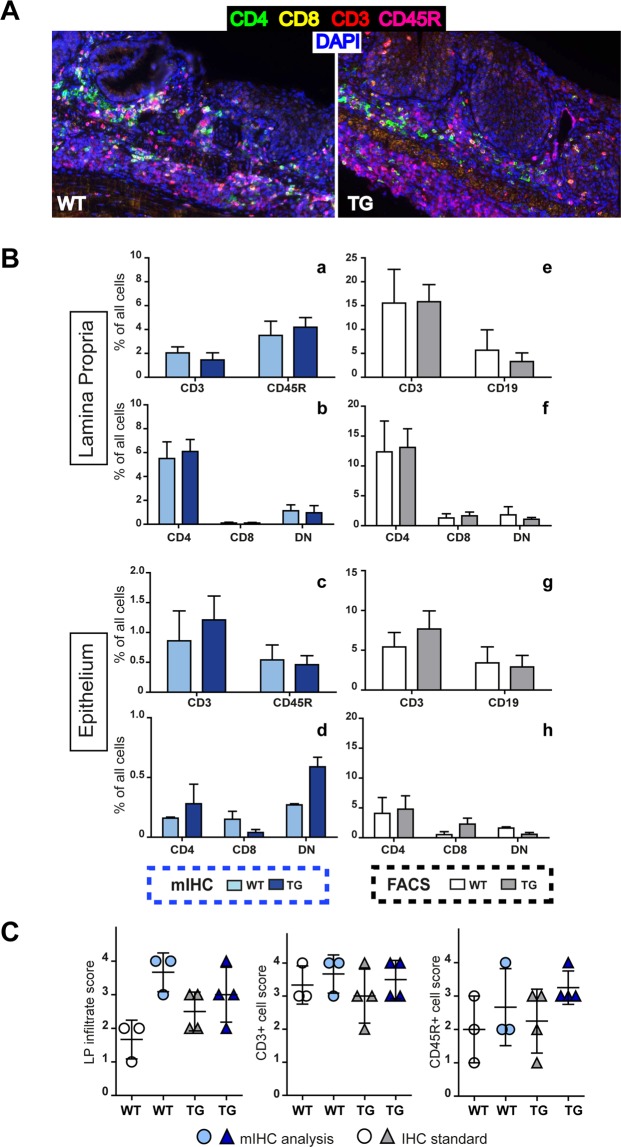
Figure 7.
Comparison of multi-staining protocol with FACS and standard IHC techniques. (A) Representative images of WT and E1 TG DSS-treated colons multiple stained for CD3 (red), CD4 (green), CD8a (yellow) and CD45R (magenta). Original magnification, 200x. (B) Leukocyte analysis of the LP (a and b) and EP (c and d) fractions performed with mIHC, calculating the percentage of each population on the number of total cells (on the left); leukocyte analysis of the LP (e and f) and EP (g and h) fractions performed with FACS, recalculating the percentage of each population on the total events (on the right). (C) Comparison between mIHC with standard IHC results. We converted the number of positive cells coming from inForm software analysis into the same score applied in the histology evaluation as reported in Fig. 2. Bar graphs show mean values ± s.d. from at least three mice individually tested per group.

