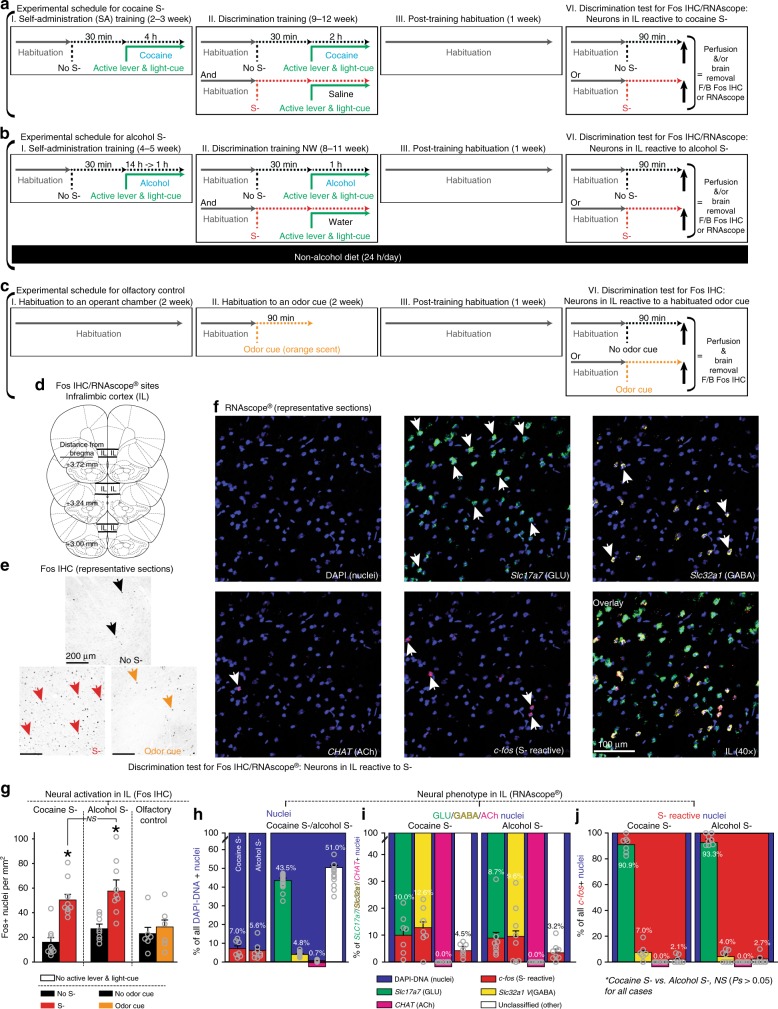
Fig. 3.
Omission cue-induced suppression (OCIS) procedures for localization and phenotypic characterization of omission cue-reactive neurons in IL. All data are mean and SEM. Gray open circles on bar charts depict individual data-points. a, b, c Timeline and schedule. d Target sites (line drawings adapted from Paxinos and Watson81 with permission). e, f Representative sections. g Effects of cocaine S-, alcohol S-, and well-habituated odor on neural activation in IL as indicated by Fos immunohistochemistry. n = 10,9,8,9,6,6. Two-way between-subjects ANOVA: Training (F(2,42) = 4.81, P < 0.05) and Cue-Test (F(1,42) = 28.67, P < 0.001) main effects, and Training x Cue-Test interaction (F(2,42) = 3.77, P < 0.05). *P < 0.001 vs. No S-. Tuckey HSD test. h, i, j Neural phenotypes in IL reactive to cocaine or alcohol S- as indicated by in situ hybridization via 4-plex RNAscope® targeting c-fos, Slc17a7, Slc32a1, and CHAT, as markers for “S- reactive”, “glutamatergic (GLU)”, “GABAergic (GABA)”, and “cholinergic (ACh)” nuclei. Each nucleus was identified by DAPI. For statistical analyses, total numbers of nuclei per mm2 that satisfied each phenotypic criterion were used. For graphic representations, percentages of each phenotype within a specific “parent” phenotype were used. h Percentages of different phenotypes within all DAPI-positive nuclei. n = 7,8,15. Individual data-points are not overlaid on the right panel for clarity because n = 15. For this panel, data from rats tested for cocaine S- and alcohol S- were pooled to represent the overall percentages of different phenotypes independent of neural activity. Two-way mixed ANOVA: Phenotype (F(4,52) = 532.79, P < 0.001), but not Group (F(1,13) = 4.05, NS) or Group x Phenotype interaction (F(4,52) = 0.34, NS). n = 7,8. i Percentages of S- reactive nuclei within different phenotypes. Two-way mixed ANOVA: Phenotype (F(3,39) = 38.62, P < 0.001), but not Group (F(1,13) = 2.5, NS) or Group x Phenotype interaction (F(3,39) = 1.74, NS). j Percentages of different neural phenotypes within S- reactive nuclei. Two-way mixed ANOVA: Phenotype (F(3,39) = 27.77, P < 0.001), but not Group (F(1,13) = 2.20, NS) or Group x Phenotype interaction (F(3,39) = 2.04, NS). n = 7,8

