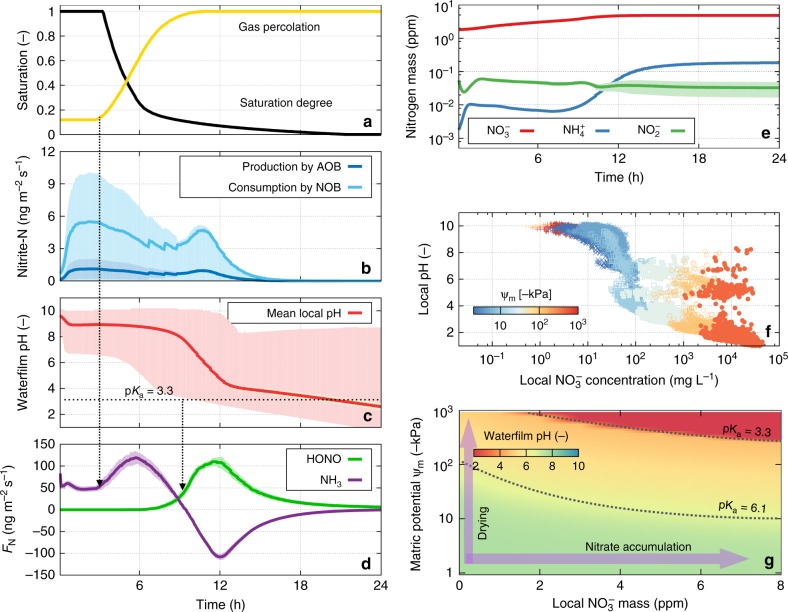
Fig. 5.
Predicted dynamic processes during biocrust desiccation. Dynamic processes during biocrust desiccation as predicted by the desert biocrusts model (DBM). The results were obtained from eight different simulations with identical boundary conditions. a Changes in saturation and increase in gas percolation during 24 h drying. b Simulated production and consumption of nirite by microorganisms; consumption by nitrite oxidising bacteria (NOB) (light blue) exceeds the production by ammonia oxidising bacteria (AOB) (dark blue). Solid lines are the averaged values and shaded areas indicate 1 standard deviation of all simulations (n = 8). c Mean local pH (red line) where spatial heterogeneity of local pH spans a wide range of pH values (shaded area indicates from the minimum to the maximum). d The dynamics of nitrous acid (HONO) (green) and ammonia (NH3) (purple) emissions from the model biocrust with positive- and negative-flux values indicate emission or uptake by the domain, respectively. e Simulated variations in inorganic nitrogen compounds with nitrate (red), ammonium (blue), and , (green) during drying (values are given in ppm with the unit g g soil−1). f Simulated local concentrations of in the aqueous phase plotted against local pH at 4 h intervals (t = 0, 4,⋯, 24) during drying (the colour bar corresponds to the matric potential, , and the values are of the simulations). g The relationship between local aqueous film pH as a function of hydration state (expressed as matric potential) and the amount of in ppm

