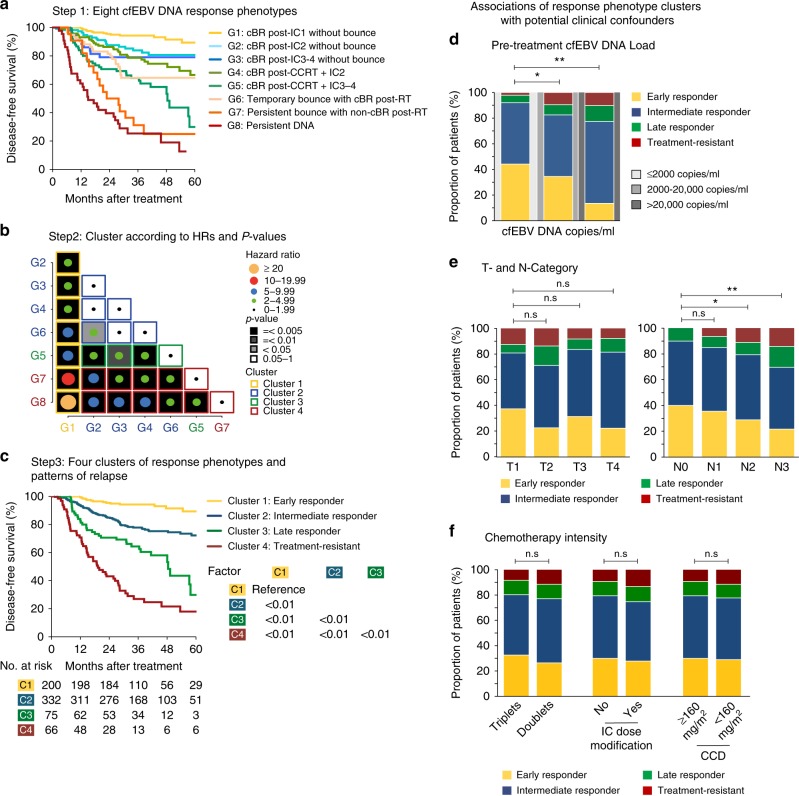
Fig. 3.
Survival clustering analyses of the different cell-free Epstein–Barr virus (cfEBV) DNA response phenotypes. a Step 1: Kaplan–Meier survival plot of disease-free survival (DFS) for the eight cfEBV DNA response phenotypes. b Step 2: Eight subgroups are then ordered in ascending numerical order and clustered by their intergroup hazard ratio (HR)DFS. HRs were represented by the size of circle and categorised by steps of 5.0; P values were represented in grey scale. We derived the following clusters: Cluster 1—G1, as G1 was significantly different from G2–8. Cluster 2—G2, G3, G4, G6, as G2–4 and G6 were not significantly different between them, except between G6 and G2. Cluster 3—G5, as G5 was significantly different from G1–4 and G8. Cluster 4—G7 and G8, as both groups were significantly different with G1–4, G6, except between G5 and G7. The clustering plot was done using ggplot2 package on R. c Step 3: Kaplan–Meier plot of DFS for the four phenotypic clusters. d Association of the phenotypes with pretreatment cfEBV DNA levels. e Association of the phenotypes with T and N categories, and f association of the phenotypes with chemotherapy intensity. cfEBV DNA levels were stratified based on previously reported cut-offs of ≤2000, >2000–20,000 and >20,000 copies/ml

