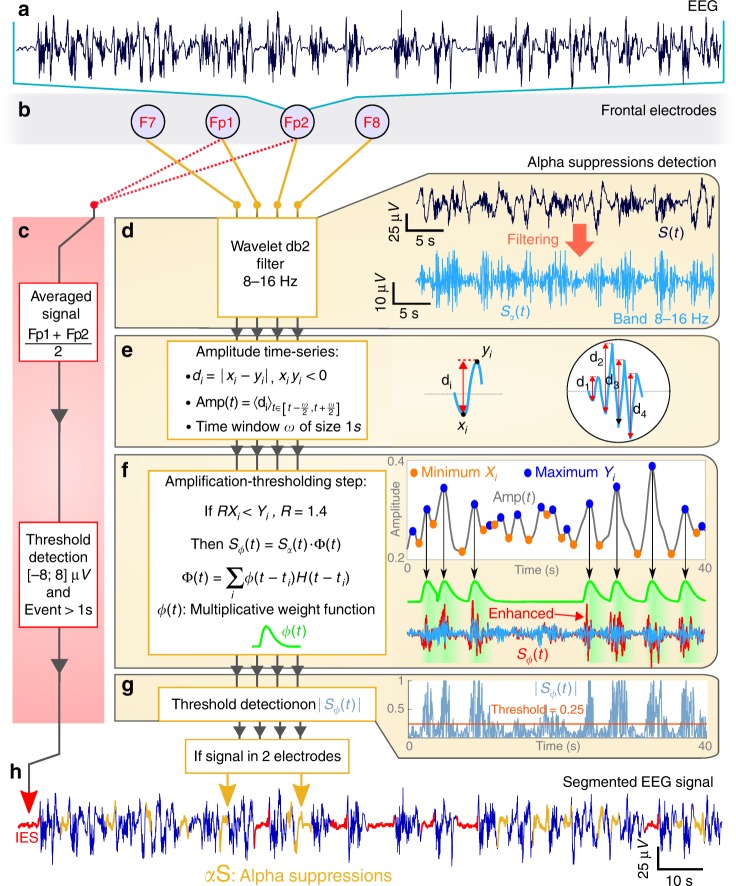
Fig. 4.
Alpha-Suppression (αS) detection procedure. a Unsegmented EEG signal. b Frontal electrodes. c Detection of IES based on Fp1 and Fp2. Box 1: signal average (Fp1 + Fp2)/2. Box2: threshold detection for regions inside ±8 μV band, lasting at least 1 s. d (Upper) EEG signal S(t) wavelet decomposition filtered in the band 8–16 Hz resulting in Sα (light blue). d (Middle) Extraction of oscillatory features of Sα(t): the minimums xi, the maximums yi, the distance di = |xi − yi|. The average Amp(t) of the distance di is computed in the widow interval [t − w/2;t + w/2], where w = 1s. d (Middle low) Nonlinear filtering enhancing transient oscillatory periods. Xi (orange) and Yi (blue) are Amp(t) (gray) minimums and maximums respectively. The multiplicative function Φ(t) is the sum of weight function ϕ(t) (green), multiplied by a Heaviside function H at time ti of maximal amplitude Yi = Amp(ti). The resulting function with enhanced oscillatory regions is Sϕ(t) = Sα(t)Φ(t) (red). d (Lower) Signal below a T = 0.25 threshold (orange) applied on normalized |Sϕ(t)| (blue) and present at least on two electrodes is considered as an α-S. e Segmented EEG signal with detected IES (red) using method (c) and α-S (yellow) using (d)

