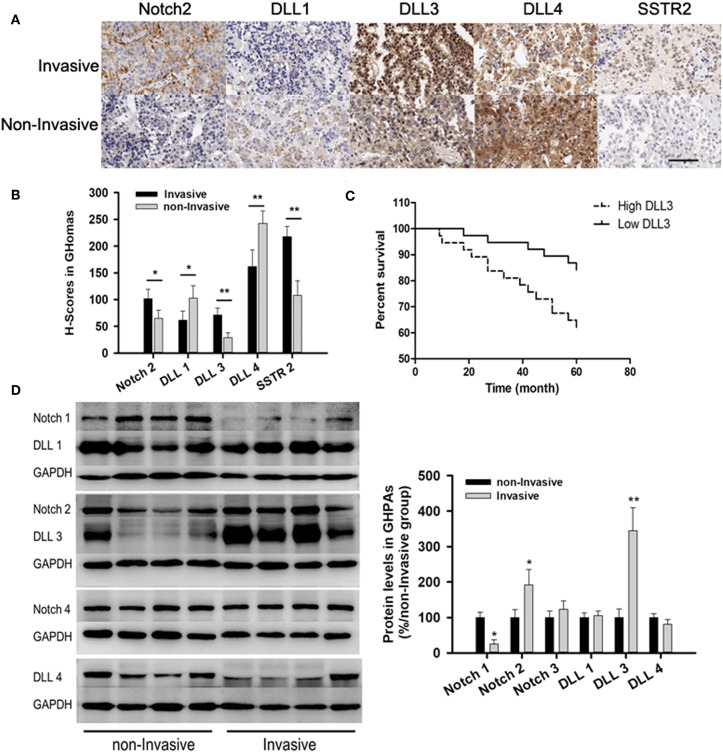
Figure 2.
Notch signaling pathways in GHomas. (A) Expression of Notch2, DLL1, DLL3, DLL4, and SSTR2 in invasive and non-invasive GHomas. Brown: positively stained. (B) H-scores of Notch2, DLL1, DLL3, DLL4, and SSTR2. P-values was indicated by * and ** (<0.05 and <0.01). (C) Disease-free survival of patients was indicated to be significantly different according to the DLL3 expression. (D) Expression of Notch signaling between invasive and non-invasive GHomas. There was significant difference of Notch1, Notch2, and DLL3 between invasive and non-invasive based on the density value of bands. Assays were performed in triplicate.

