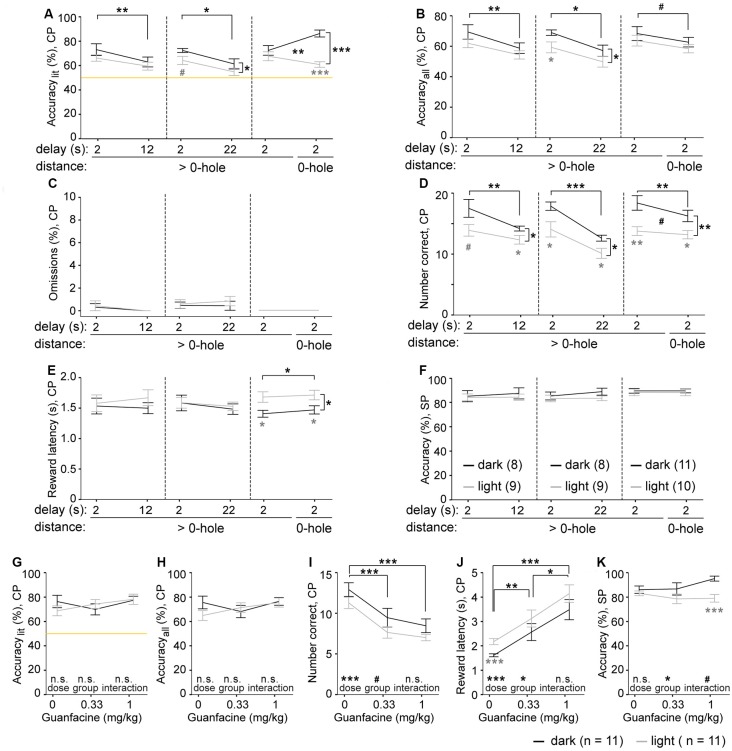
Figure 2.
Effects of challenges and guanfacine on 5-CSWM performance. (A–F) Performance parameters for three distinct challenge paradigms and their individual baseline (averages of two sessions in each case), including an extension of the delay from 2 s to 12 s (left) and 22 s (middle), and the use of choice options that were always directly neighboring holes (right) instead of having 1–2 non-illuminated holes in between them. Parameters indicate SWM according to accuracylit (A) and accuracyall (B), calculated as in Figure 1, the relative number of CP omissions (normalized to number of CPs, C), the absolute number of correct CP responses (D), the CP reward latency as control variable for motivation (E), and the accuracy with which the illuminated hole was chosen in the SP as control variable for cue-directed attention (F). Black significance indicators refer to repeated-measures ANOVA, effects of group displayed on vertical lines, effects of challenge on horizontal lines, interactions indicated between data-lines; gray stars indicate simple main-effects post hoc comparison between groups at individual conditions. N-numbers for groups trained in the dark (black) and light (gray) protocol are indicated in panel (F). (G–K) Performance parameters for SWM, accuracylit (G) and accuracyall (H), as well as number of correct CP responses (I), the CP reward latency as control variable for motivation (J), and the accuracy with which the illuminated hole was chosen in the SP as control variable for cue-directed attention (K) are plotted for the groups tested in the dark (black) and light (gray) protocol after guanfacine pre-treatment at the indicated doses (n-numbers stated in legend underneath respective panels; 2 s SP-SD, 12 s delay). For clarity, statistical effects of drug-dose, group and interactions found in repeated-measures ANOVA are indicated above the respective words in each panel, while simple main-effects paired dose-comparisons are indicated on horizontal lines (black) and pairwise comparison between groups at individual doses are indicated below the data points (gray). n.s. or no indication p > 0.1, #p < 0.1, *p < 0.05; **p < 0.01; ***p < 0.001. All data is shown as mean ± SEM.

