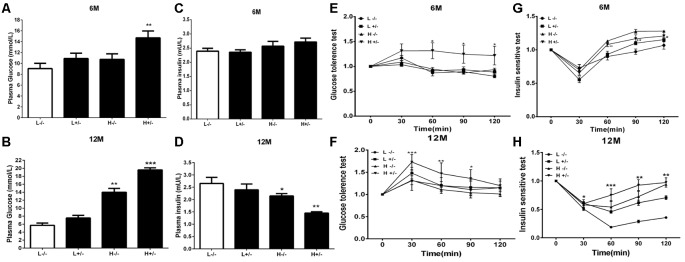
Figure 1.
Blood biochemistry parameters of human islet amyloid polypeptide (hIAPP−/−) or hIAPP−/+ mice fed with a high/low-fat diet for 6 or 12 months. (A) Plasma glucose content at 6 months after treatment. (B) Plasma glucose content at 12 months after treatment. (C) Plasma insulin content at 6 months after treatment. (D) Plasma insulin content at 12 months after treatment. (E) Results of the glucose tolerance test (GTT) at 6 months after treatment. (F) Results of the GTT at 12 months after treatment. (G) Results of the insulin sensitivity test at 6 months after treatment. (H) Results of the insulin sensitivity test at 12 months after treatment. L−/− denotes hIAPP−/− mice on a low-fat diet; L+/– denotes hIAPP+/– mice on a low-fat diet; H−/− denotes hIAPP−/− mice on a high-fat diet; H+/– denotes hIAPP+/– mice on a high-fat diet. n = 12, *p < 0.05, **p < 0.01, ***p < 0.001 compared with the L−/− group.

