Figure 5.
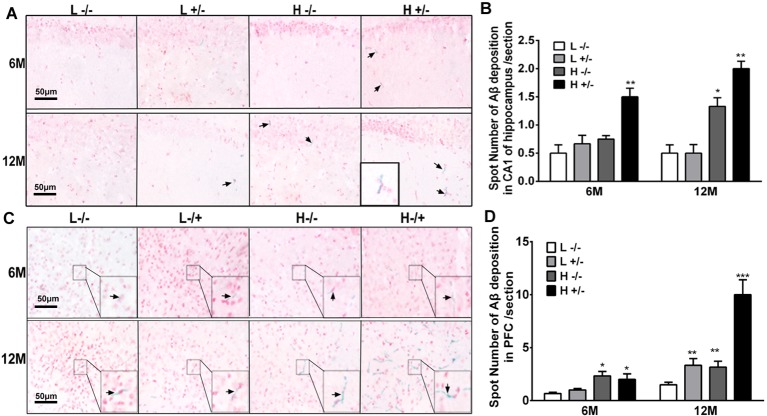
Aβ42 deposition in the hippocampi and prefrontal cortexes of hIAPP−/− and hIAPP−/+ mice were enhanced by a high-fat diet. (A) Representative images of Aβ42-positive staining in the hippocampal CA1 regions of hIAPP−/− and hIAPP+/– mice treated with a high/low-fat diet for 6 or 12 months. Black arrows indicate Aβ42-positive particles. (B) Six sections per mouse were stained, and semiquantitative analysis was performed using ImageJ software. (C) Representative images of Aβ42-positive staining in the prefrontal cortexes of hIAPP−/− and hIAPP+/– mice treated with a high/low-fat diet for 6 or 12 months. Black arrows indicate Aβ42-positive particles. (D) Six sections per mouse were stained, and semiquantitative analysis was performed using imageJ software. L−/− denotes hIAPP−/− mice on a low-fat diet; L+/– denotes hIAPP+/– mice on a low-fat diet; H−/− denotes hIAPP−/− mice on a high-fat diet; H+/– denotes hIAPP+/– mice on a high-fat diet. n = 6, *p < 0.05, **p < 0.01, ***p < 0.001 compared with the L−/− group.

