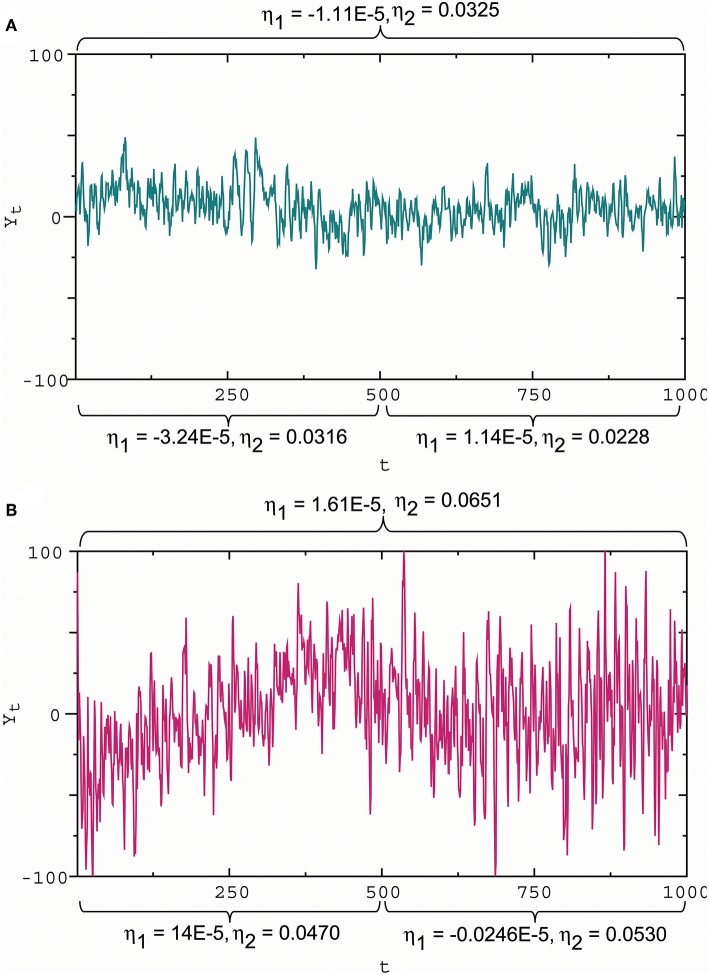
Figure 6.
Slope and amplitude of fluctuations and the waveform indicators. (A) Small amplitude fluctuations with a gentle downward slope in the first half and almost zero slope in the second half, corresponding to the slope indicator and the amplitude indicator η2 = 0.0325 for the whole interval, and η2 = 0.0316 for the first half, and and η2 = 0.0228 for the second half. (B) Large amplitude fluctuations with a steep upward slope in the first half and a gentle downward slope in the second half, corresponding to and η2 = 0.0651 for the whole interval, and η2 = 0.0470 for the first half, and and η2 = 0.0530 for the second half. These results show that a positive/negative slope indicator reflects an upward/downward slope, while a large/small absolute slope indicator describes a steep/gentle slope; a large/small amplitude indicator reflects a high/low amplitude. Here these wave indicator values were the estimates based on observational data.

