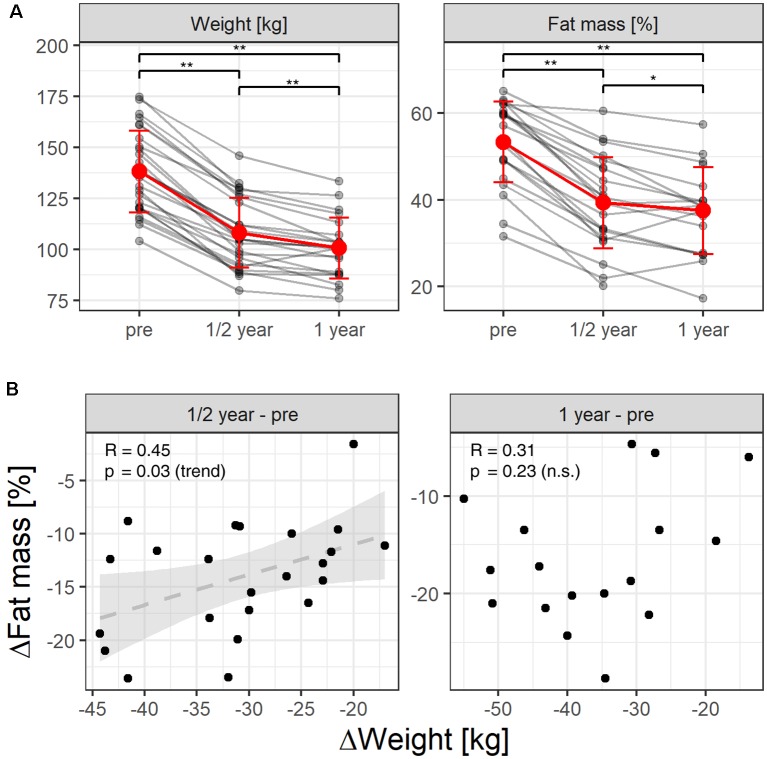
Figure 1.
(A) Individual weight and fat loss before and after gastric-bypass surgery (after 6 month and after 1 year). Red color indicates the mean over time. The whiskers the standard deviation. *Indicate a p-value of post hoc t-tests < 0.025, **indicate p < 0.001. (B) Pearson-correlation unexpectedly revealed that reductions in fat mass (%) and reductions in body weight (kg) correlated only by trend over the 1st 6 months after surgery, whereas after 12 months we found no correlation between both adiposity measures.

