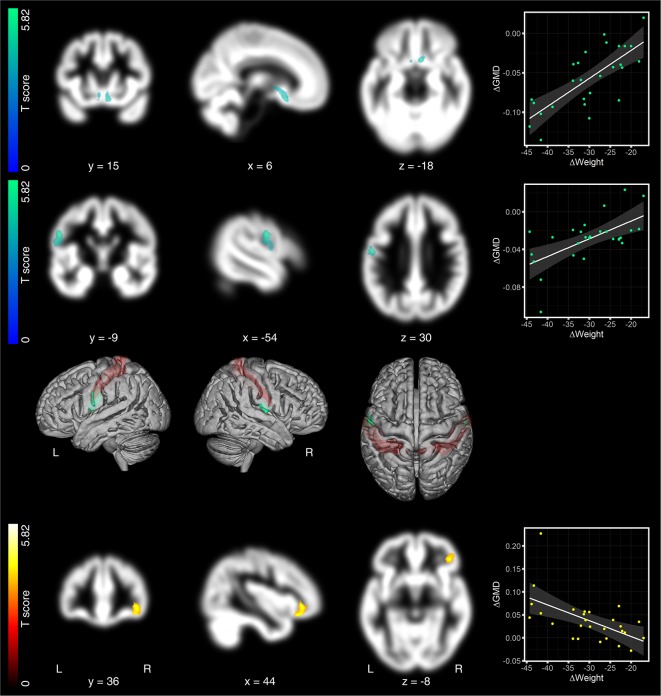
Figure 2.
Regression analyses between changes in gray matter density (GMD) maps and weight, 6 months after surgery. The loss of body weight (in kg) from pre to 6 months after surgery was associated with decreased GMD in the hypothalamus (top row) and the left postcentral gyrus (second row). In right postcentral gyrus, directly opposite to the left-sided cluster, we identified another cluster, which did not survive significance threshold. Due to the symmetry of both clusters across both hemispheres, we considered this non-significant cluster, nevertheless, as relevant for the discussion (third row). The only region that presented significantly increased GMD was the right lateral OFC (bottom row). Significant GMD clusters are projected on patients’ mean GMD template. Hot colors indicate positive and cold colors negative associations. GMD effects are presented on a coronal, sagittal, and axial brain slice (from left to right). Coordinates below each brain slice indicate clusters’ peak coordinates in Montreal Neurological Institute (MNI) space. “L” indicates the left, “R” the right brain hemisphere. The color bar on the left side indicates the T-scores for the cluster presented in that row. In the 3rd row, we superimposed effects on both postcentral gyri on a rendered brain. Postcentral gyri are colored in red. Scatter plots on the right to the brain slices show the relationship between changes in GMD and changes in weight. Changes in GMD, as shown in the scatter plots, were extracted as the 1st Eigenvariate at p = 0.025 family-wise error (FWE), cluster-threshold and p = 0.0005, uncorrected peak threshold.

