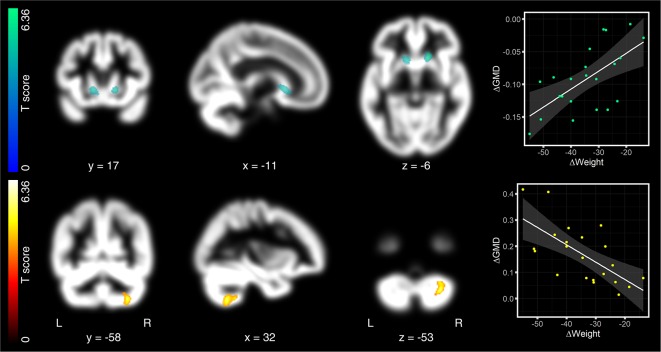
Figure 3.
Regression analyses between changes in GMD maps and weight, 12 months after surgery. After 12 months, the loss of body weight was associated with decreased GMD in the left caput caudate. This cluster reached peak significance level, but just missed significant cluster threshold (p = 0.029; threshold at p = 0.025, FWE-corrected; first row). Directly opposite to this cluster, we also identified the right caput caudate, but below the significant threshold. We, nevertheless, considered both clusters together as relevant for the discussion due to the symmetry of effects. Increased GMD after 12 months was observed in the right cerebellar lobule VII (second row). As in Figure 2, hot colors indicate positive and cold colors negative associations. Significant clusters are projected on patients’ mean GMD template, presented on a coronal, sagittal, and axial brain slice (from left to right). Coordinates below each slice index coordinates of the clusters’ peak in MNI space. “L” indexes the left, “R” the right brain hemisphere. The left-sided color bar shows the T-scores for the respective GMD cluster. Right-sided scatter plots present the association between changes in GMD and changes in body weight. As for Figure 2, changes in GMD in the scatter plots were extracted as the 1st Eigenvariate at p = 0.025 FWE, cluster-threshold and p = 0.0005, uncorrected peak threshold.

