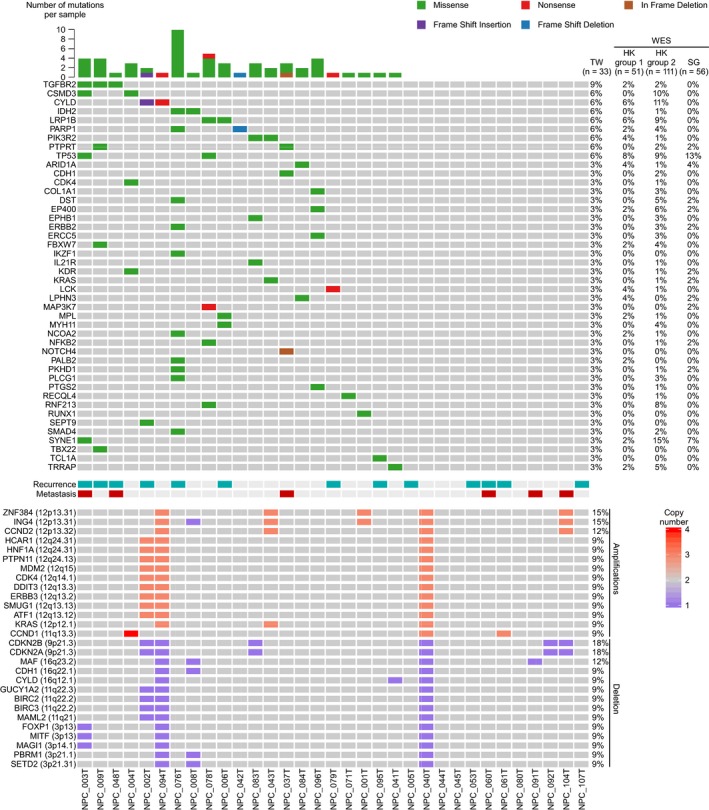
Figure 1.

Genetic alterations profile of 33 NPC tumors. Matrix showing the gene alterations (rows) of 33 NPC tumors (columns) analyzed by targeted sequencing of 409 cancer‐associated genes. Gene mutations and CNVs were shown in upper panel and lower panel, respectively. Genes were ordered by mutation frequency and alphabet. The number of mutations for each patient was plotted in the upper panel. In comparison, the mutation frequency of the same gene in other WES studies (HK group 1, HKU; HK group 2, CUHK; and Singapore) was indicated. Each CNV shown in this figure was identified in at least three patients. Amplification and deletion are defined as copy number ≥3 and ≤1, respectively. The clinical outcomes (recurrence and metastasis) for each patient were indicated in the middle panel
