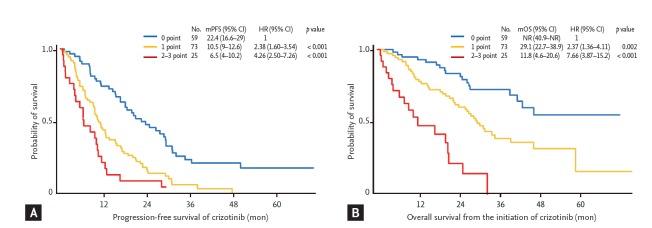
Figure 2.
Survival analysis according to a proportional hazards model in training cohort. Kaplan-Meier curves for progression-free survival (A) and overall survival (B) after crizotinib treatment in the training cohort according to a proportional hazards model are shown. Score indicates how many factors were present (i.e., Eastern Cooperative Oncology Group performance status, same or more than 2; number of metastatic organs, same or more than 3 organs; and no response by crizotinib treatment). mPFS, median progression-free survival; CI, confidence interval; HR, hazard ratio; mOS, median overall survival.

