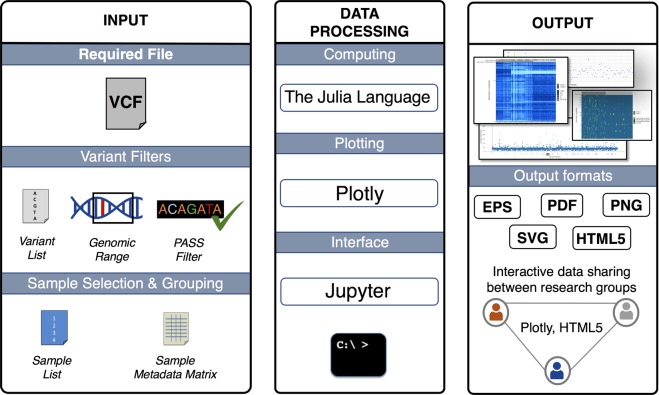
Figure 2.
Workflow of VIVA. INPUT: VCF file is a required file. Users can use one or any combination of variant filters, sample selection, and grouping options. DATA PROCESSING: Data processing requires the Julia programing language and depends on several well-maintained Julia packages. Plotting uses the PlotlyJS.jl wrapper for Plotly. VIVA has two interface choices. Users may use the program through a Jupyter Notebook or from the command line. OUTPUT: VIVA’s four visualization options include heatmaps of genotype and read depth data as well as scatter plots of average sample read depth and average variant read depth data. These visualizations can be saved in HTML, PDF, SVG, or EPS formats. HTML format enables users to share and analyze the data interactively between research groups which supports collaborative work environments.

