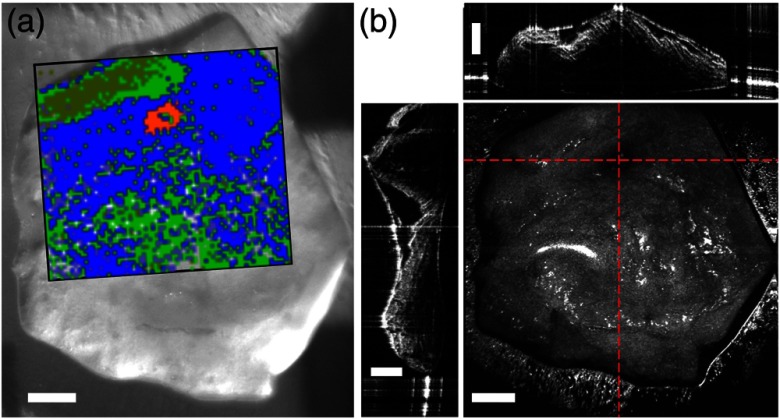
Fig. 3.
(a) Bright-field image with overlaid Raman cluster image displayed in Fig. 2(a) and orthogonal cross sections through the recorded OCT volume together with the maximum intensity projection en face OCT image in (b) of a human retina sample. The red lines in the en face image display the position of the depth B scans on the top and left. White bars represent scale bars of 1 mm.

