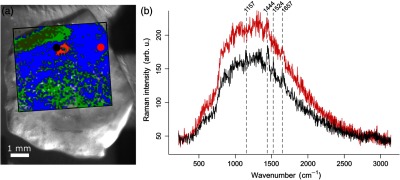
Fig. 5.

(a) Bright-field image with overlaid Raman cluster image of a human retina sample with two Raman measurement positions marked in black and red. (b) Unprocessed mean Raman spectra recorded with the in-house built setup at the two positions marked by the black and red spot in (a) with the corresponding color coding.
