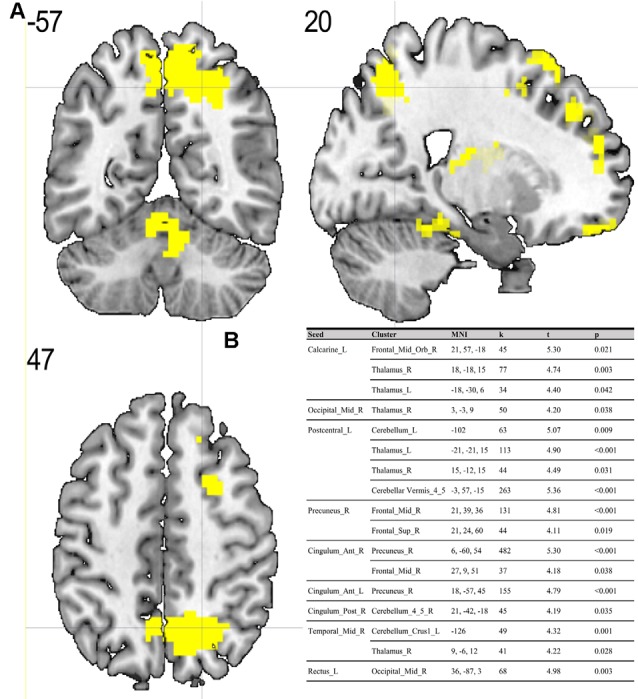
Figure 1.

(A) Results of two-sample t-test on functional connectivity maps with MS > ES contrast. Yellow areas depict increased functional connectivity in the morning session (MS) compared to the evening session [ES; p < 0.05; false discovery rate (FDR) corrected on cluster level]. (B) Table representing seeds with the presence of at least one positively correlated cluster with significant (p < 0.05; FDR corrected on cluster level) differences between morning and evening sessions.
