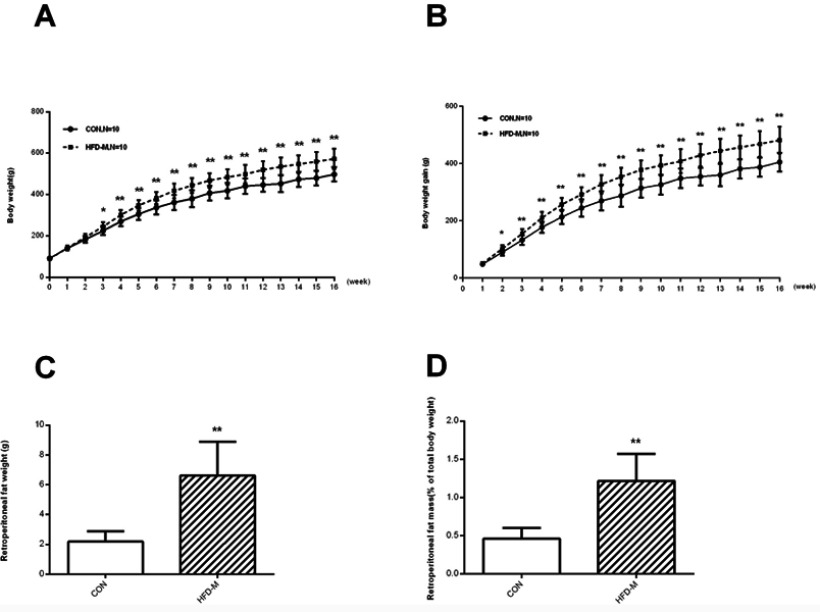
Figure 1.
Body weight and retroperitoneal fat mass in control (n=10) and HFD-M (n=10) rats. The comparison between CON and HFD-M groups in (A) Body weight; (B) body weight gain; (C)retroperitoneal fat weight; (D) retroperitoneal fat mass (% of total body weight). *P<0.05, **P<0.01.
Abbreviations: CON, control; HFD-M, high-fat diets containing margarine.

