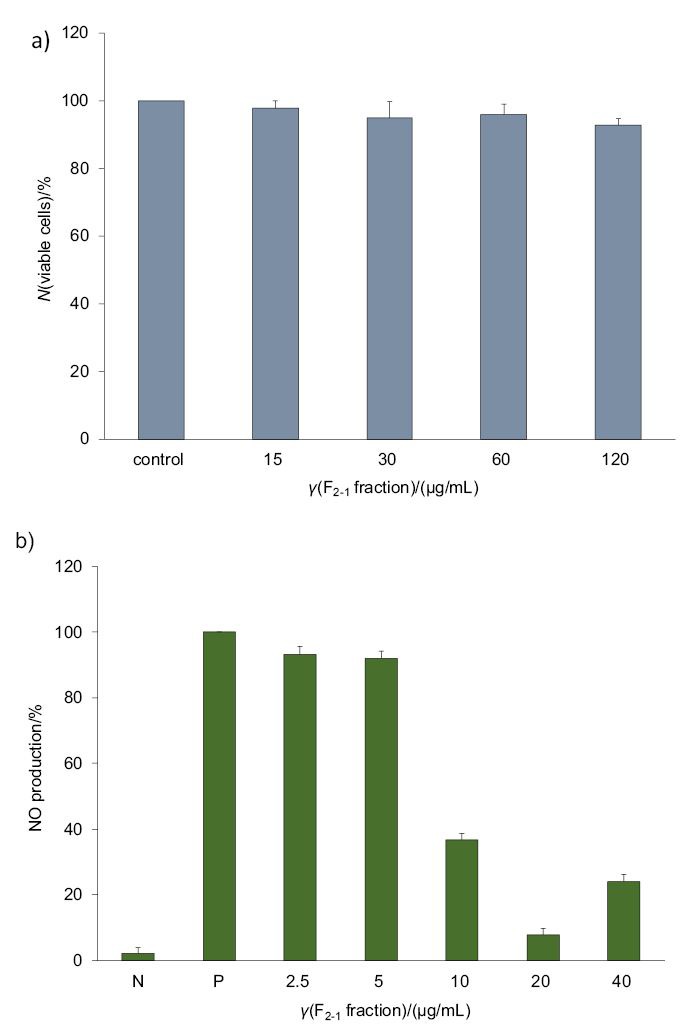
Fig. 2.

Effect of different concentrations of F2-1 fraction on: a) viability of and b) NO production by lipopolysaccharide (LPS)-stimulated RAW 264.7 macrophage cells, where N and P represent the negative (cells alone) and positive (cells+LPS) controls respectively
