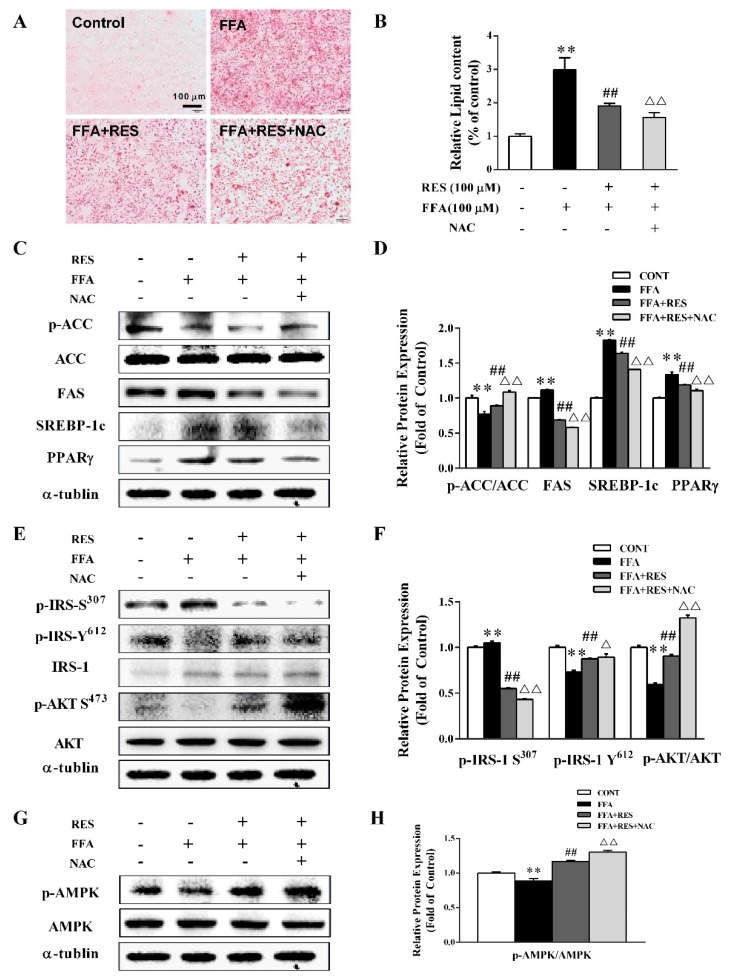
Figure 4.
RES restores FFA-induced impairment of hepatic lipid metabolism via the elimination of ROS. HepG2 cells were preincubated for 30 min with/without N-acetylcysteine (NAC) (10 µM) and then pretreated with/without RES (100 µM) for 6 h and with FFA (100 µM) for 24 h. (A) Lipid accumulation of HepG2 cells was measured by Oil Red O staining and qualitative analysis using an inverted microscope (×200). (B) Quantitative analysis shown in (A)using a microplate reader (492 nm). (C) The expression levels of p-ACC, total ACC, FAS, SREBP-1c, and PPARγ was detected in cells by western blot analysis, and α-tubulin was used as a loading control. (E) The effect of RES on FFA-induced insulin signaling changes was determined by western blot analysis. p-IRS-1 Tyr612, p-IRS-1 Ser307, total IRS-1, p-AKT Ser473, and total AKT were detected in cells, IRS-1, AKT, and α-tubulin served as controls. (G) Representative western blot of p-AMPK and total AMPK after treatment with RES and FFA in HepG2 cells. (D), (F), and (H) Densitometric analysis of the blots shown in (C), (E), and (G), respectively. Data were presented as the mean ± SD, n ≥ 3. (∗) p < 0.05 and (∗∗) p < 0.01, versus control group; (#) p < 0.05 and (##) p < 0.01, versus FFA group; (△)p < 0.05 and (△△)p < 0.01, versus RES pretreatment with FFA group.

