Figure 1.
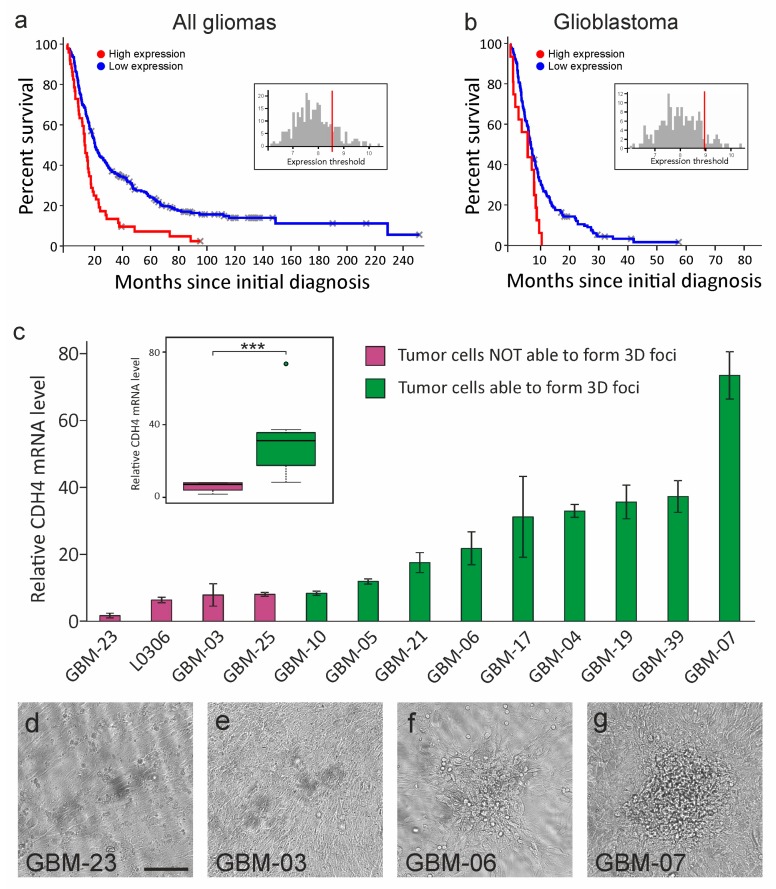
Cdh4 expression in human gliomas. (a,b) Kaplan–Meier curves of all glioma (a) or glioblastoma (b) patients with low or high Cdh4 expression level. The inset shows the frequency plot of Cdh4 expression level in the analyzed tumors. Threshold was chosen to group in the high expression pool tumors with a Cdh4 expression level higher respect to healthy tissue. (c) The histogram shows the quantification by quantitative PCR of Cdh4 mRNA level in different human glioblastoma initiating cells (GIC) cultures normalized to GBM-23, which have the lowest Cdh4 expression level. Purple bars represent GICs whose proliferation is inhibited by cell–cell contact, while green bars represent GICs able to proliferate over cell confluence. The barplot in the inset shows the differential Cdh4 expression levels between these two groups of GICs. (d–g) Bright field micrographs representing over confluence GIC cultures. Scale bar: 500 µm. *** p < 0.001.

